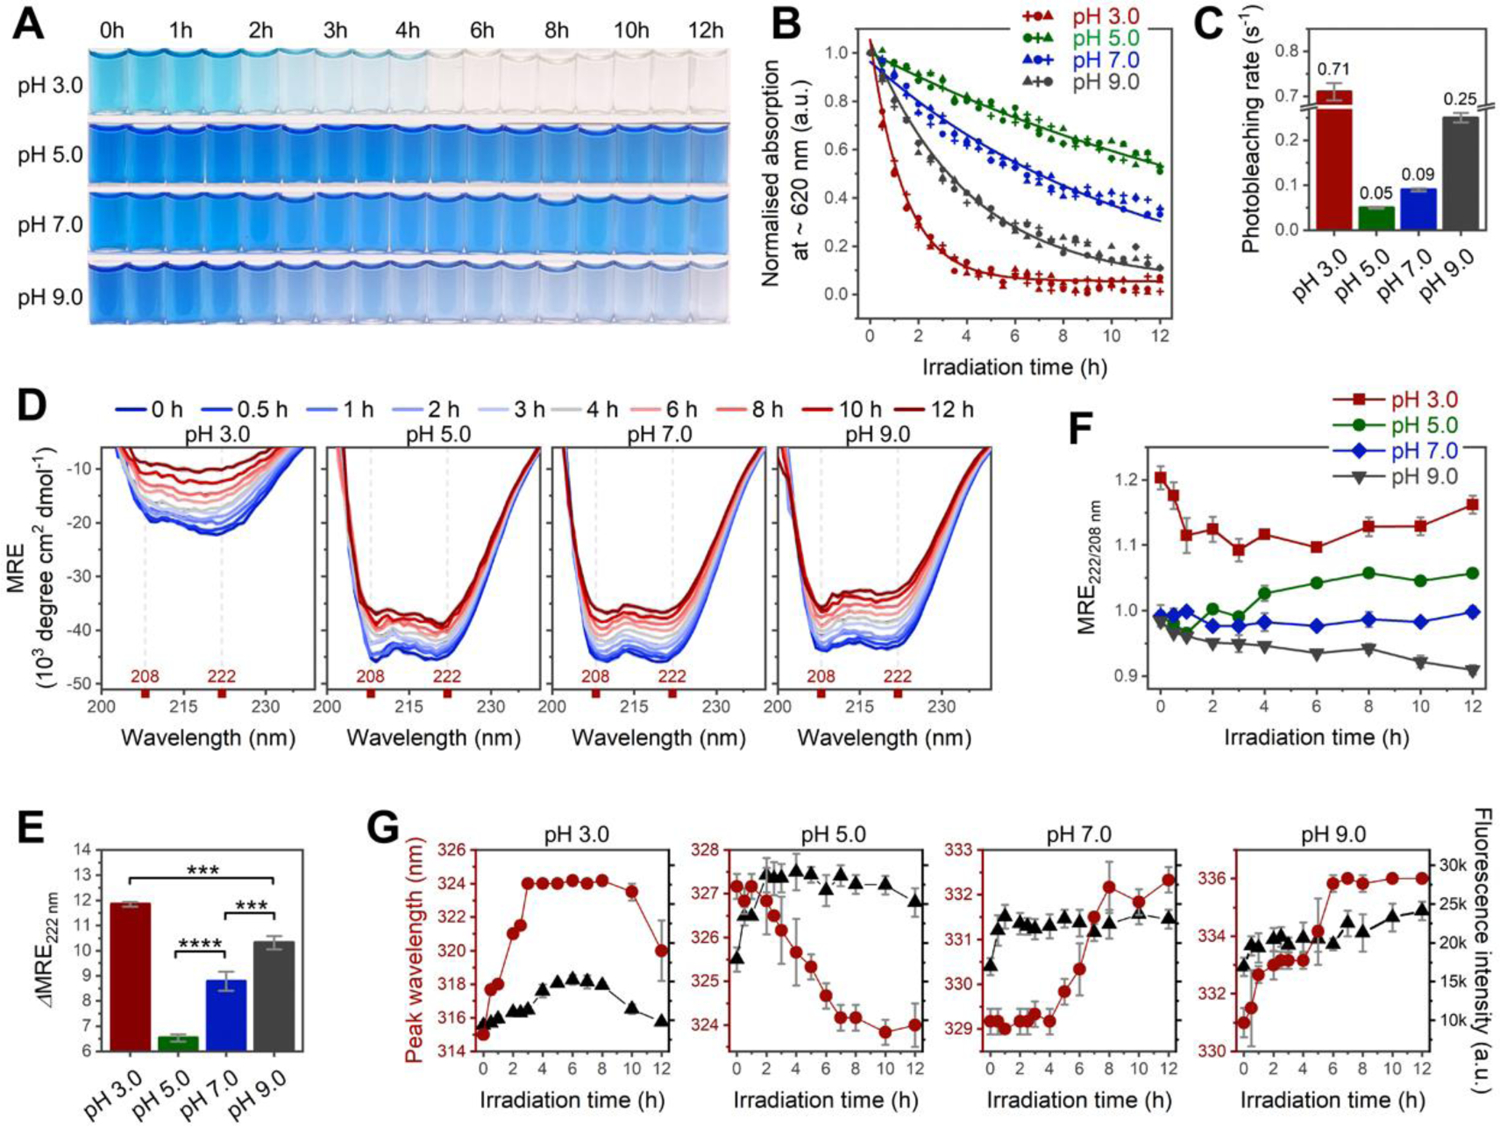
Figure 3. Spectroscopic analyses for irradiation-induced photobleaching and conformational change at pH 3.0–9.0.

(A–B) Changes in color and Q-band absorption of C-PC as a function of irradiation time. Absorptions in (B) are recorded at peak maxima indicated in Figure S8C. n = 3 independent samples; each individual point represents the mean of three technical replicates. (C) Photobleaching rate constant calculated from data points in (B) (see section 1.1.6 in SI for details). (D) Far-UV CD spectra of C-PC at pH 3.0–9.0 after 0−12 h of irradiation. (E) Irradiation-induced secondary structural changes calculated by the difference in mean residue ellipticity (MRE) minima at 222 nm before and after 12 h of irradiation (ΔMRE222). (F) Irradiation-induced changes in interhelical contacts traced by ratios of MRE minima at 222 and 208 nm (MRE222/208). (G) Intensity (black) and peak wavelength (red) of protein intrinsic fluorescence plotted against irradiation time. All irradiations were performed under a 365-nm UV lamp; n = 3 independent samples, mean ± s.d. Statistical significance in (E) was calculated using one-way ANOVA with Tukey’s honest significant difference test. ***P<0.001; ****P<0.0001. Panels (F–G) reveal irradiation-induced aggregation at pH 5.0 versus irradiation-induced unfolding at pH 3.0, 7.0, and 9.0.
