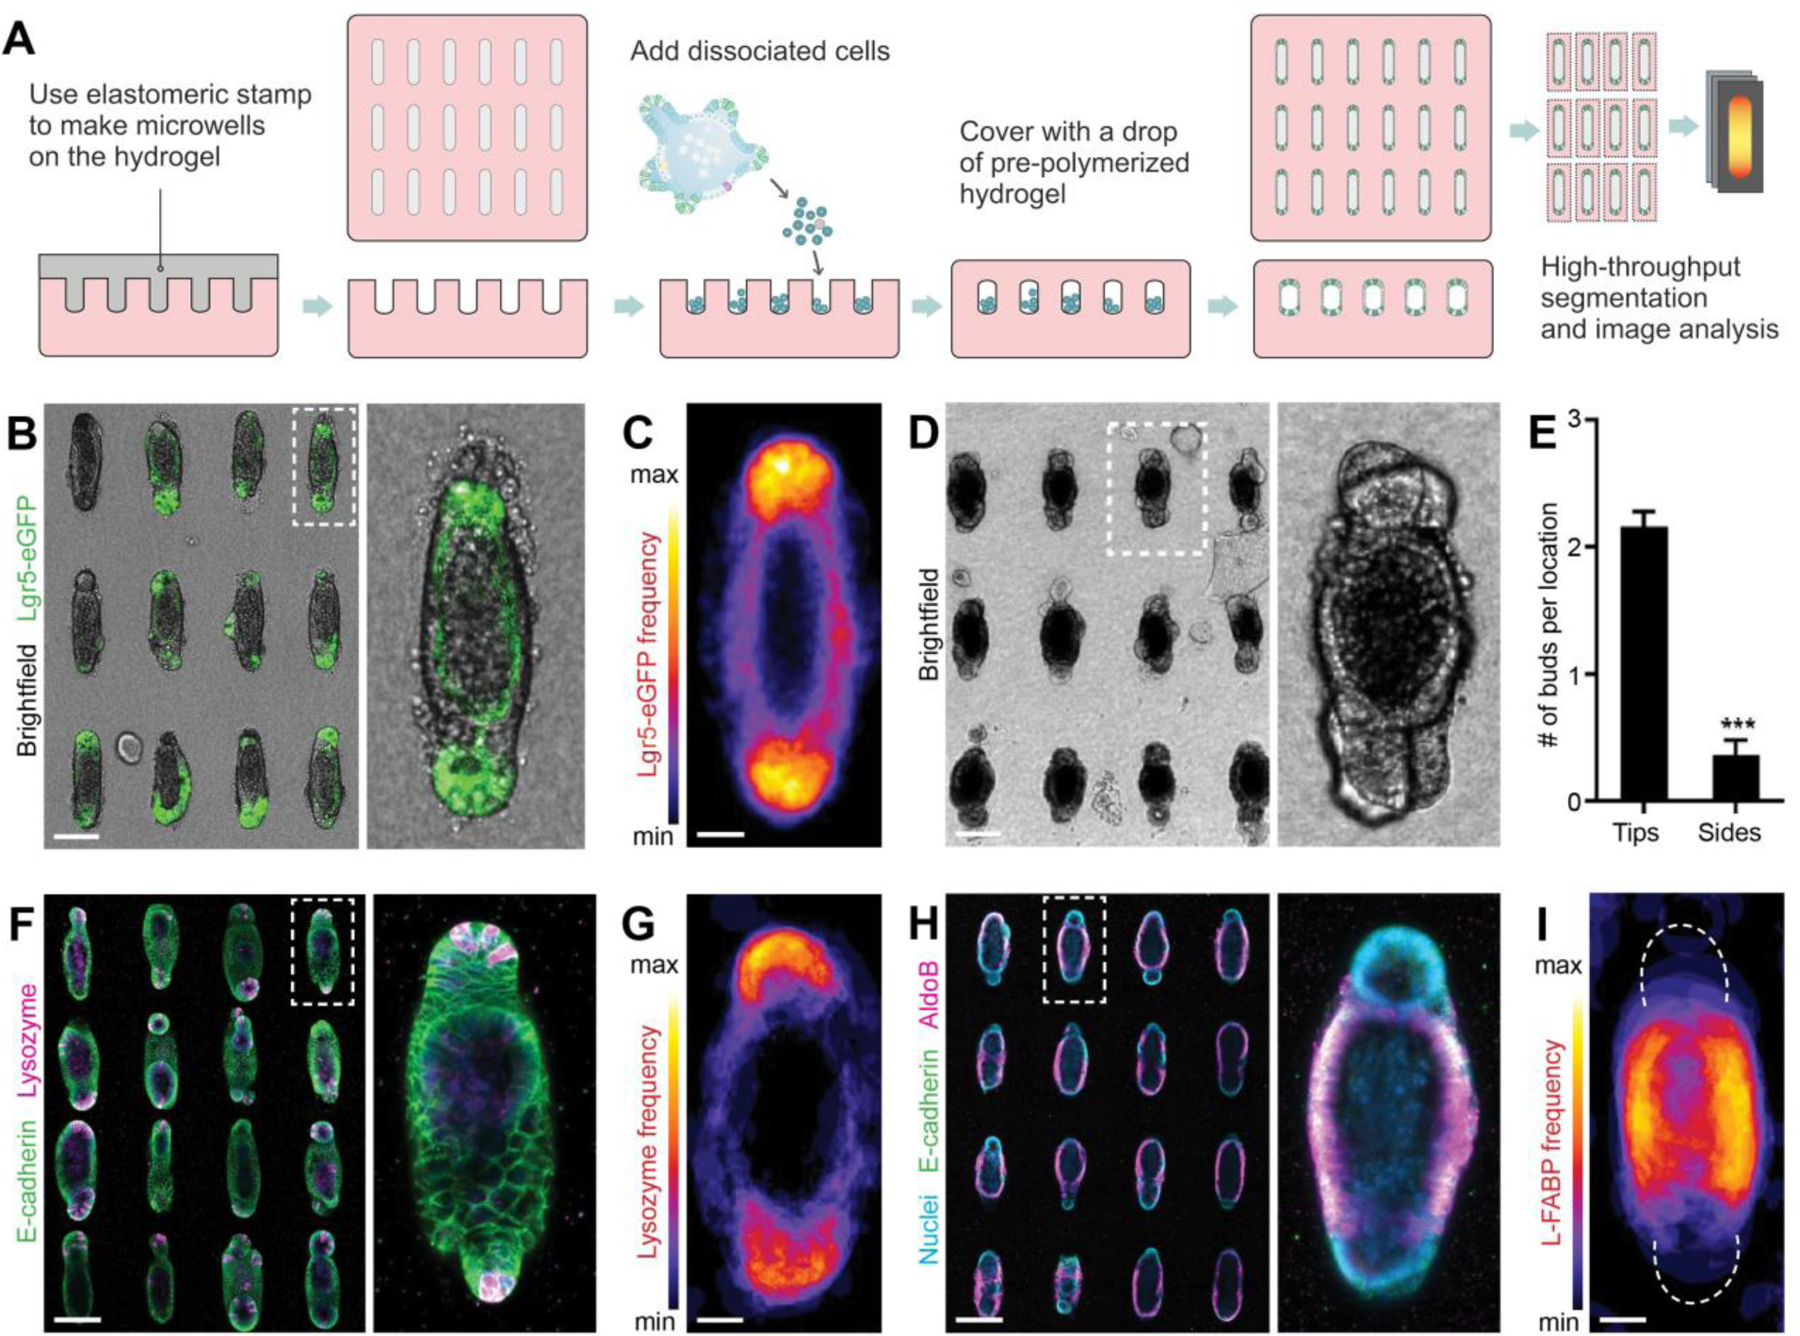
Figure 2: Geometrically controlled symmetry-breaking and epithelial patterning within intestinal organoids.

(A) Schematic depicting the generation of microfabricated tissues of controlled size and shape. (B) An array of intestinal organoids formed from engineered intestinal tissues of rod-like geometry and magnification. (C) Frequency map, showing average Lgr5 expression over ~80 tissues. (D) An array of intestinal organoids at day 5 and (E), quantification of the average number of buds per location within tubular intestinal tissues. (F) Paneth cells staining by lysozyme in the array of intestinal organoids and (G) average Paneth cell distribution. (H) AldoB-expressing enterocytes within rod-shaped organoids and (I) average enterocyte distribution. (B, D, F, H) Scale bars, 100 μm. (C, G, I) Scale bars, 25 μm.
