
Figure 3: Tissue geometry controls organoid patterning through cell shape-mediated regulation of YAP and Notch signaling.
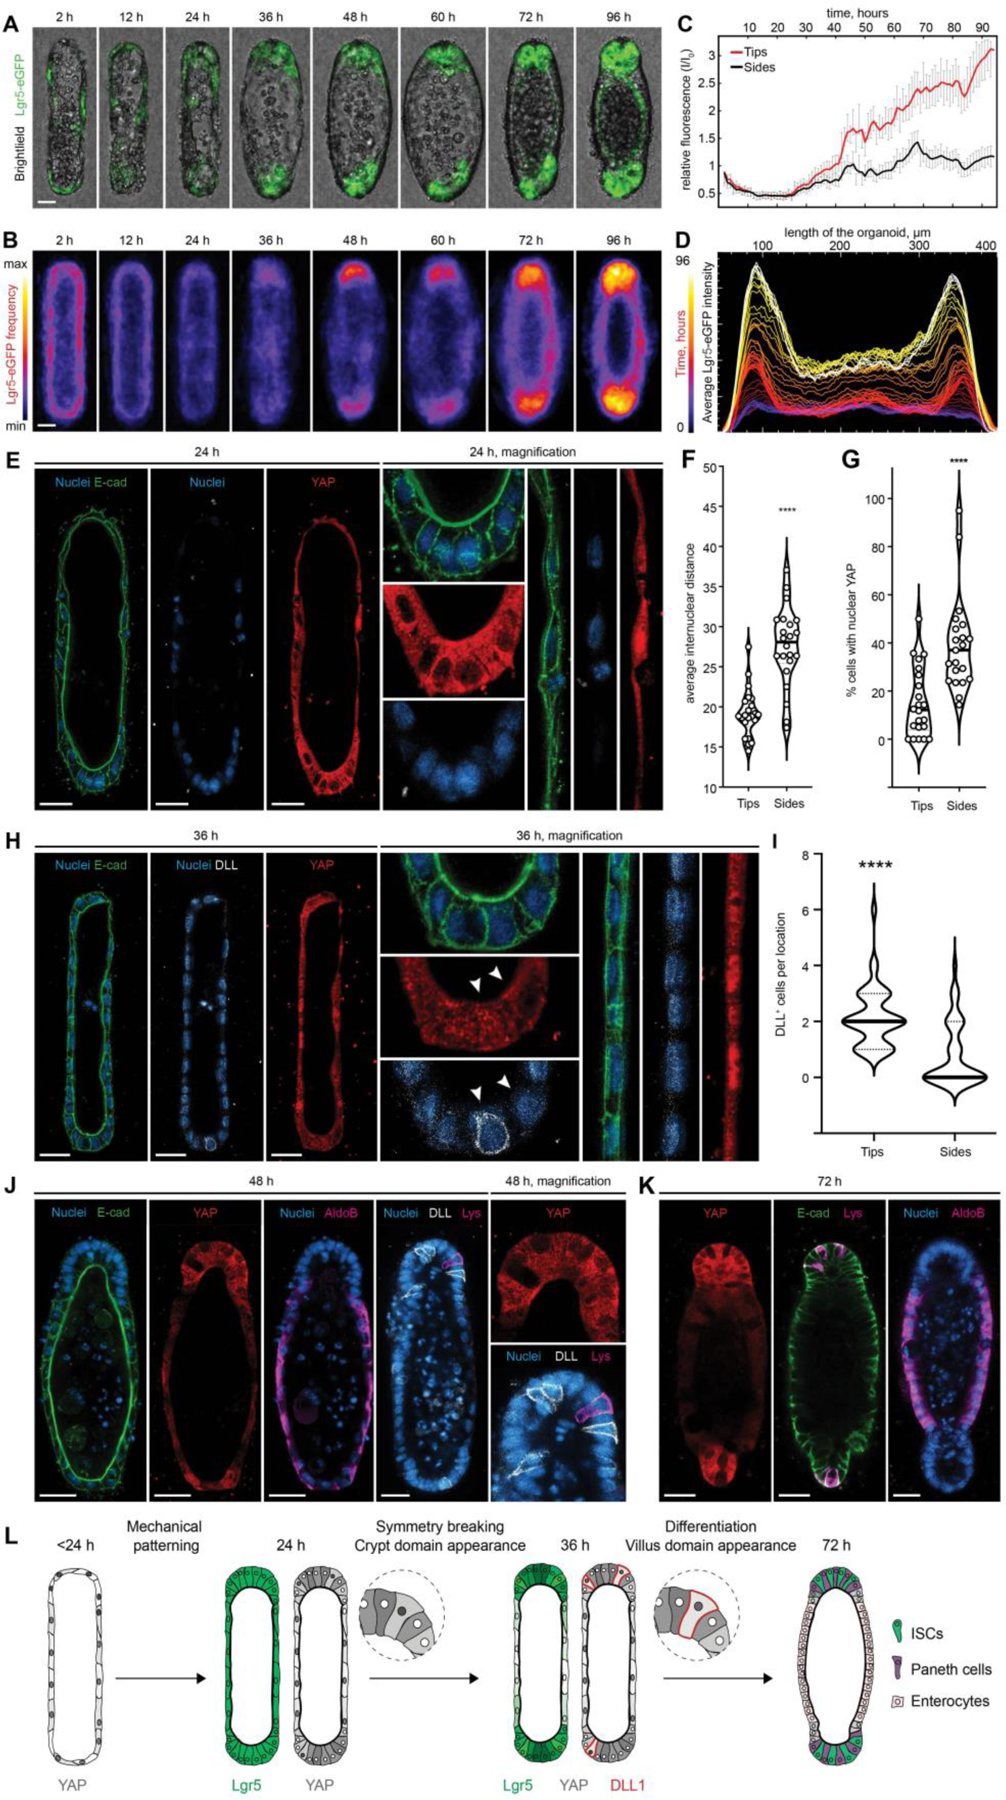
(A) Brightfield and Lgr5-eGFP time-lapse imaging of the representative organoid development and (B) frequency maps, showing average Lgr5 expression over ~80 tissues. (C) Relative changes in the Lgr5-eGFP expression in curved ends and flat sides of the organoids over time and (D) Lgr5-eGFP localization along length of the averaged tissue over time. (E) Immunofluorescence images showing the difference in internuclear distance, cell shape and the subcellular distribution of YAP between cells of the end and the side regions, 24 hours after cell loading. (F) Quantification of internuclear distance within the end and side regions of the tissues. Individual points, which represent the distance between neighboring nuclei, and means are shown. **** P < 0.0001 (G) Quantification of the nuclear localization of YAP within cells of the different organoid regions. Individual points and means are shown. **** P < 0.0001. (H) Immunofluorescence images showing the difference in the subcellular distribution of YAP cells between cells of the end and the side regions and appearance of the first DLL+, 36 hours after cell loading. (I) Quantification of DLL+ cells localization. **** P < 0.0001 (J, K) Immunofluorescence images showing YAP expression and localization of the enterocytes (AldoB), Paneth cells (Lys) and DLL+ cells in the representative organoids. (L) Schematic illustration summarizing the proposed mechanism of the geometry driven organoids patterning. Scale bars, 25 μm.