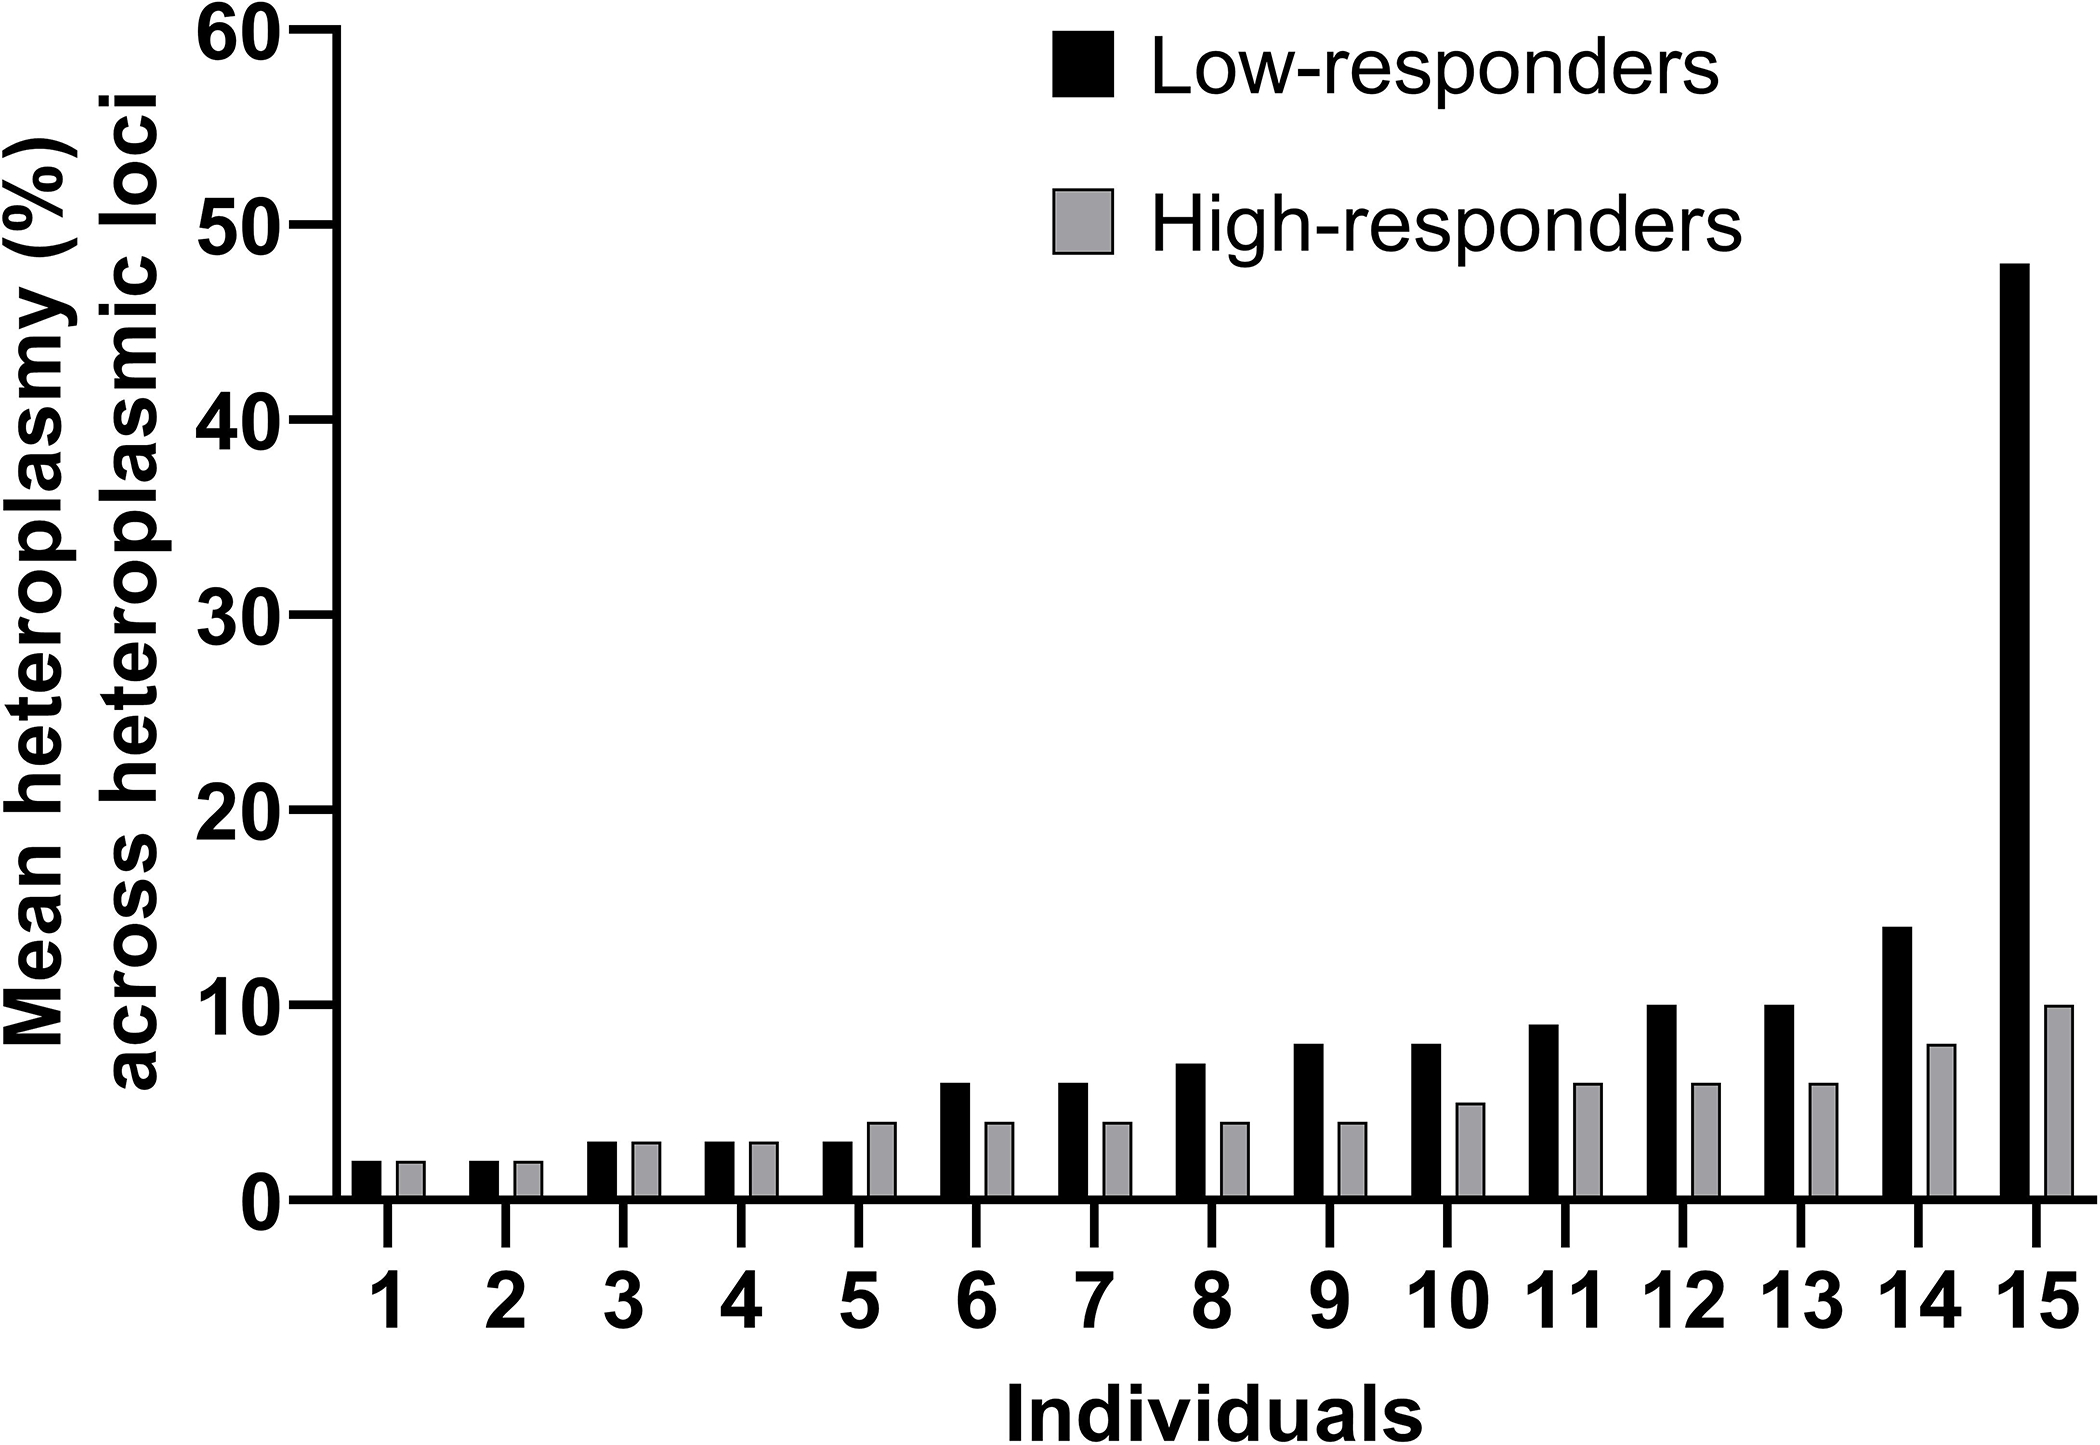
Figure 3:

Average Percent Mitochondrial DNA Heteroplasmy Frequency Across Heteroplasmic Loci. The average percent frequency of heteroplasmy across heteroplasmic loci = percent frequency of heteroplasmy across heteroplasmic loci in each of the low- and high-responder individuals. Heteroplasmic loci = mtDNA position where an individual had a minor allele occurrence ≥ 1% (i.e., heteroplasmy) in each of the low- and high-responder individuals. Individual data points are presented in ascending order according to the average percent heteroplasmy across heteroplasmic loci. Black bars = average percent heteroplasmy frequency across heteroplasmic loci in the individuals categorized as low-responders; grey bars= average percent heteroplasmy frequency across heteroplasmic loci in the individuals categorized as high-responders. Wilcoxon rank sum test p = 0.05.
