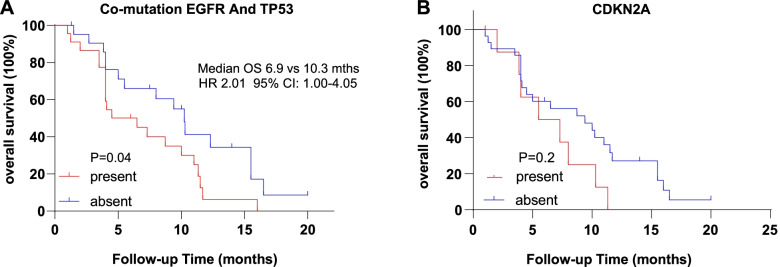
Fig. 2.
OS associated with the presence or absence of related genes. Kaplan–Meier curves of patients with or without relative genes. A, with or without co-mutation of EGFR and TP53. B, presence or absence of CDKN2A. OS was defined as the time from diagnosis of leptomeningeal metastasis to death or the last follow-up time. p values were calculated using a two-sided log-rank test. Hazard ratios were calculated with the use of a Cox proportional hazard model. EGFR denotes epidermal growth factor receptor. TP53 denotes the tumour protein P53. OS overall survival. CI confidence interval. HR hazard ratio

