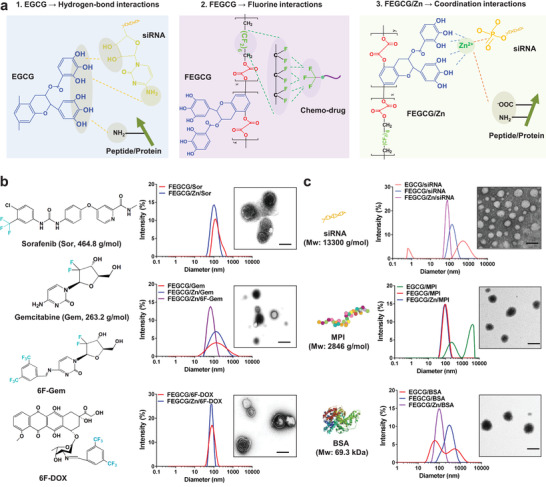
Figure 2.

a) Schematic illustration reveals the driving forces provided by FEGCG/Zn for delivery of diverse biomolecules. b) Size distribution and TEM images of Sor NPs, Gem/6F‐Gem NPs, and 6F‐DOX NPs. c) Size distribution and TEM images of siRNA polyplexes, MPI complexes, and BSA complexes. Scale bar = 100 nm.
