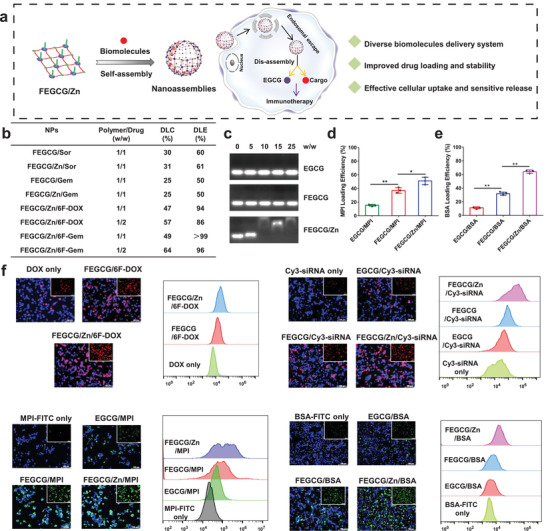
Figure 3.

a) Schematic illustration of FEGCG/Zn based nanoassemblies and their advantages in biomolecule delivery in vitro. b) DLC and DLE of different chemo‐drugs in FEGCG or FEGCG/Zn NPs. c) siRNA loading efficiency determined by agarose gel electrophoresis. d,e) MPI or BSA loading efficiency determined by FITC fluorescence quenching assay (n = 3). The cytosolic delivery efficiency of DOX NPs, Cy3‐siRNA polyplexes, FITC‐MPI complexes, and FITC‐BSA complexes determined by confocal microscopy and flow cytometry. Scale bar = 100 µm. f) Data are presented as the means ± SD. Error bars represent the standard deviations of three separate measurements. *P < 0.05, **P < 0.01 by one‐way analysis of variance (ANOVA) followed by Turkey's multiple comparisons.
