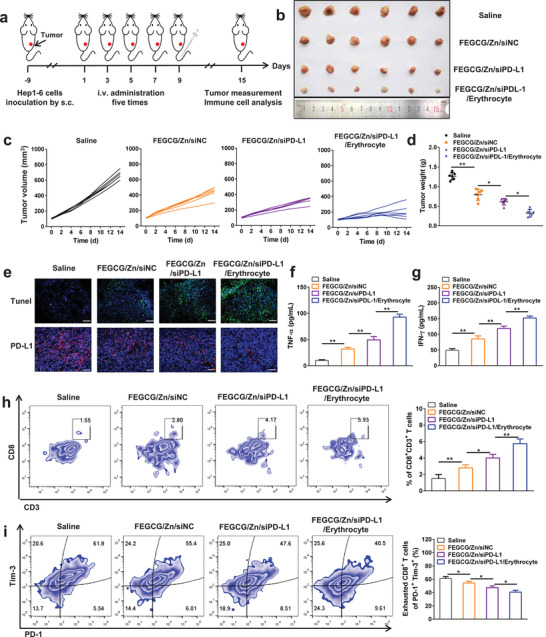
Figure 5.

Antitumor immunotherapy and immune activation in vivo. a) Schematic of the treatment regimen. b) Representative photographs of collected tumor tissues, c) the tumor growth curves of individual mice, and d) the tumor weight after different treatments of saline, FEGCG/Zn/siNC, FEGCG/Zn/siPD‐L1, and FEGCG/Zn/siPD‐L1/erythrocyte (n = 6). e) Representative images of TUNEL and PD‐L1 immunofluorescence staining in tumor tissues. Scale bar = 100 nm. f,g) The levels of TNF‐α and IFN‐γ in plasma (n = 6). Flow cytometry assay and quantitative analysis of CD8+CD3+T cells in h) CD45+ cells and i) exhausted CD8+ T cells in lymphocytes (n = 5). Data are presented as the means ± SD. Error bars represent the standard deviations of at least three separate measurements. *P < 0.05, **P < 0.01 by one‐way ANOVA analysis followed by Turkey's multiple comparisons.
