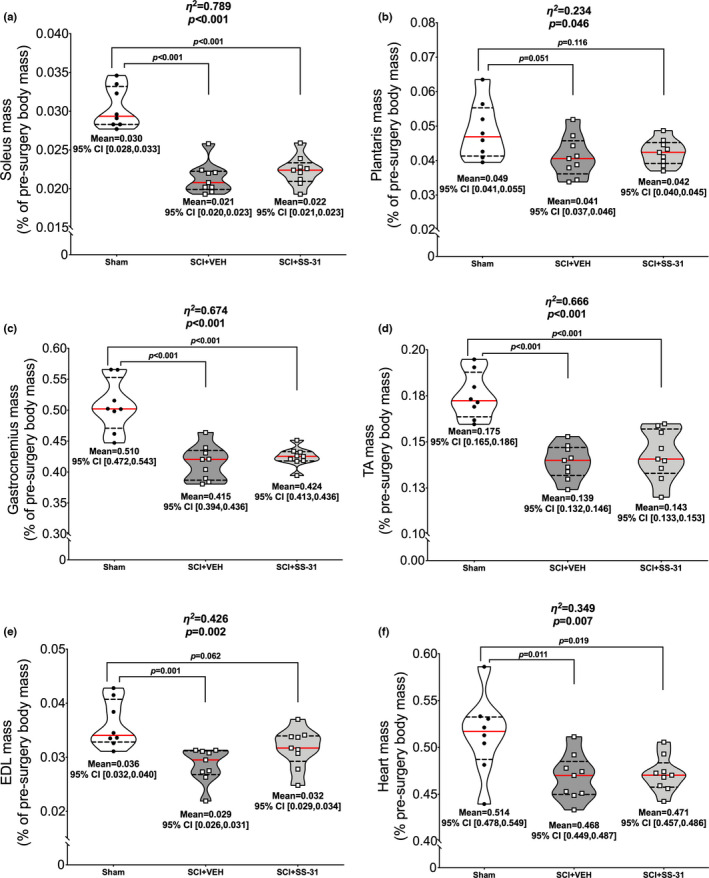
FIGURE 2.

SS‐31 did not prevent losses in muscle mass. There was no effect of SS‐31 on muscle mass as both SCI groups had similar losses in normalized (a) soleus, (b) plantaris, (c) gastrocnemius, (d) TA, (e) EDL and (f) heart mass 7 days post‐contusion SCI when compared to sham animals. Data are presented with corresponding eta 2 and p values from ANOVA testing. All individual data points are shown in violin plots with median (solid red) and quartile (dotted black) lines. Group means and lower and upper bounds of 95% confidence intervals are shown in bold at the bottom of each violin plot. Between group brackets signify mean differences and are presented with the p value from Tukey’s follow‐up testing
