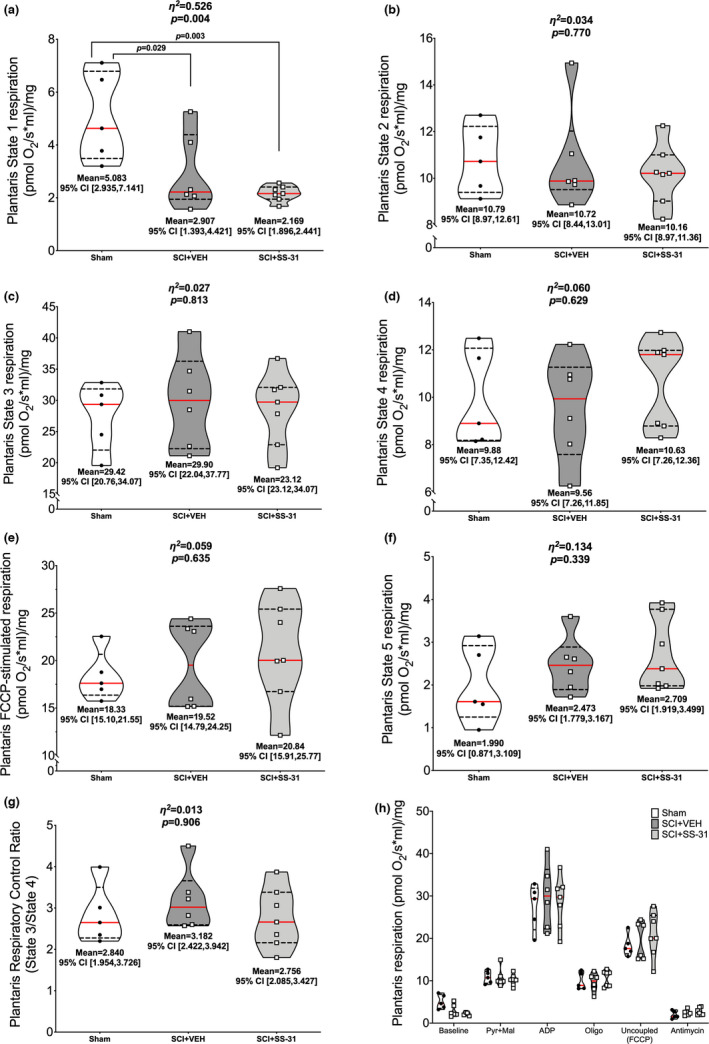
FIGURE 4.

Ex vivo oxygen consumption of the plantaris using high‐resolution respirometry. SCI led to reduced (a) State 1 (baseline) respiration rates but no differences were observed during: (b) pyruvate +malate‐stimulated State 2 respiration, (c) ADP‐stimulated State 3 respiration, (d) oligomycin‐induced State 4 respiration, (e) FCCP‐induced uncoupled respiration or (f) antimycin‐induced State 5 respiration, or (g) respiratory control ratios (State 3/State 4). (h) Overall summary figure. Data are presented with corresponding eta 2 and p values from ANOVA testing. All individual data points are shown in violin plots with median (solid red) and quartile (dotted black) lines. Group means and lower and upper bounds of 95% confidence intervals are shown in bold at the bottom of each violin plot. Between group brackets signify mean differences and are presented with the p value from Tukey’s follow‐up testing
