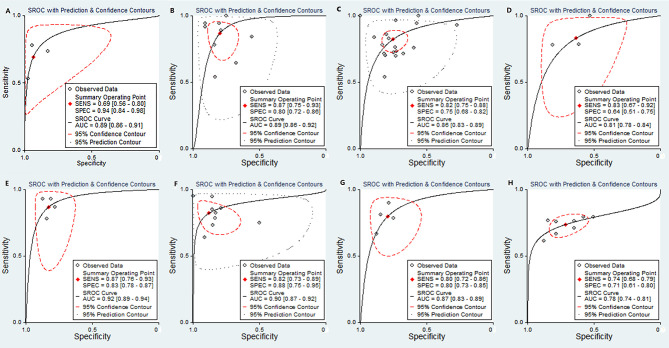
Figure 10.
SROC plots of the MK value (A), D value (B), ADCmean (C), and ADCmin (D) for discriminating pdHCC. SROC plots of the D value (E) and ADC mean (F) for discriminating wdHCC. SROC plots of the D value (G) and ADC mean (H) for discriminating MVI+ in HCC. SROC, summary receiver operating characteristic; AUC, area under curve; pdHCC, poorly differentiated hepatocellular carcinoma; wdHCC, well differentiated hepatocellular carcinoma; MVI, microvascular invasion; HCC, hepatocellular carcinoma.

