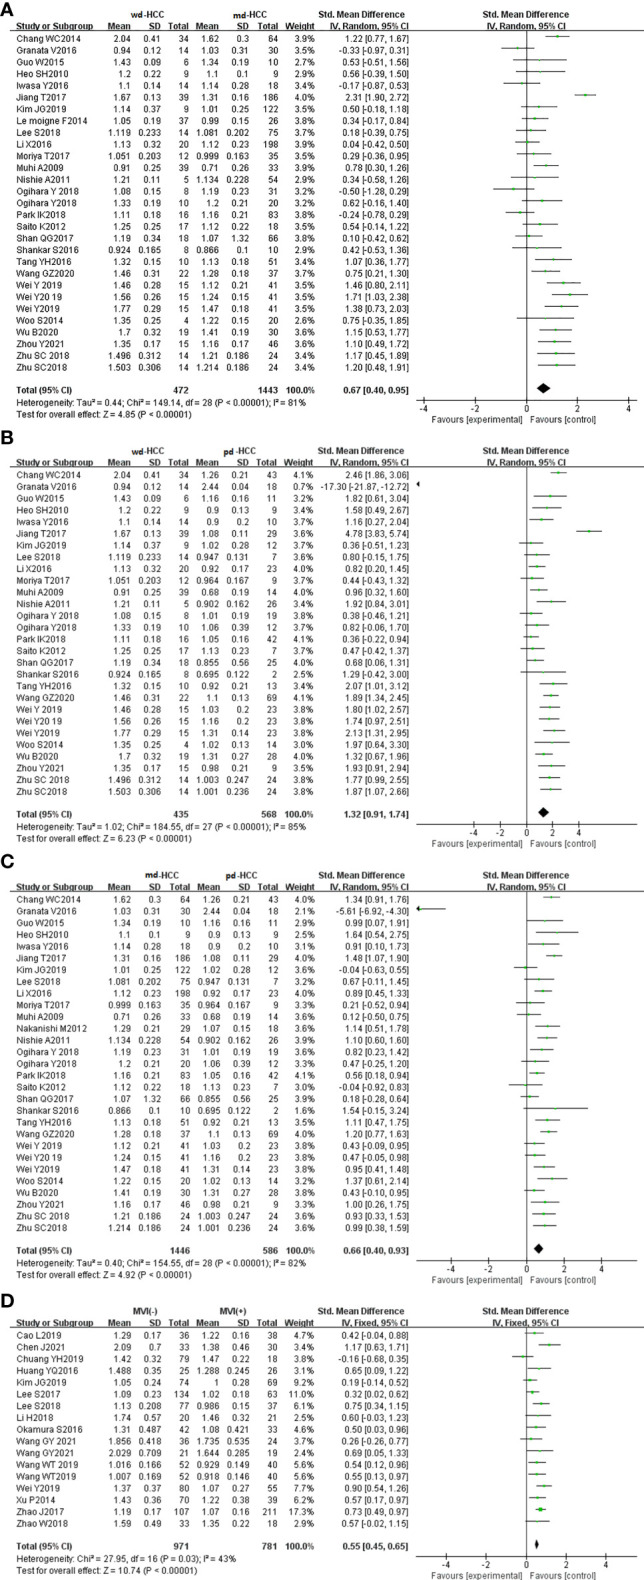
Figure 3.

(A) Forest plot of ADCmean between wdHCC and mdHCC. The SMD indicated that the ADCmean of mdHCC was significantly lower than that of wdHCC. (B) Forest plot of the ADCmean between wdHCC and pdHCC. The SMD indicated that the ADCmean of pdHCC was significantly lower than that of wdHCC. (C) Forest plot of the ADCmean between mdHCC and pdHCC; the SMD indicated that the ADCmean of pdHCC was significantly lower than that of mdHCC. (D) Forest plot of the ADCmean between MVI- and MVI+. The SMD indicated that the ADCmean of MVI+ HCC was significantly lower than that of MVI- HCC. wd-HCC, well differentiated hepatocellular carcinoma; md-HCC, moderately differentiated hepatocellular carcinoma; pd-HCC, poorly differentiated hepatocellular carcinoma; MVI, microvascular invasion; SMD, standardized mean difference.
