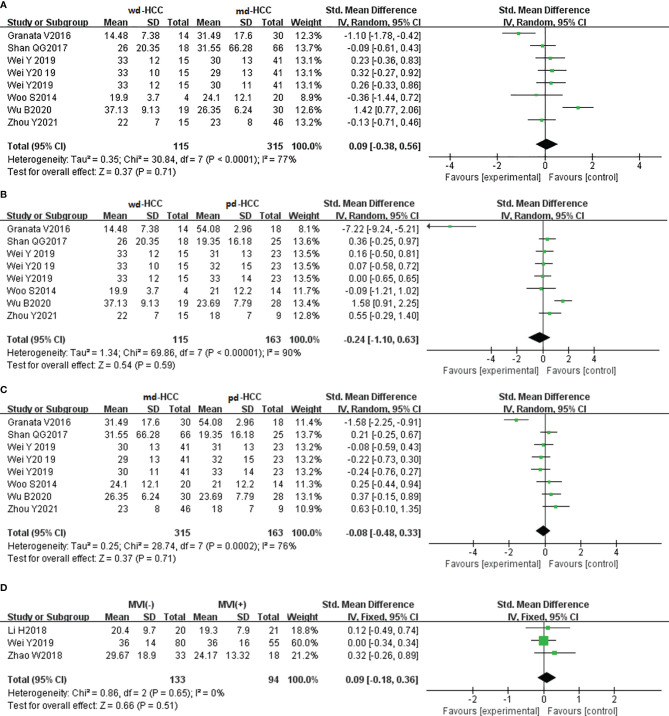
Figure 7.
(A–C) Forest plot of the f values distinguished wdHCC, mdHCC, and pdHCC. The SMDs indicated that there was no significant difference for grades in HCC. (D) Forest plot of the f values between MVI- and MVI+. The SMD indicated that there was no significant difference for MVI in HCC. wd-HCC, well differentiated hepatocellular carcinoma; md-HCC, moderately differentiated hepatocellular carcinoma; pd-HCC, poorly differentiated hepatocellular carcinoma; MVI, microvascular invasion; SMD, standardized mean difference.

