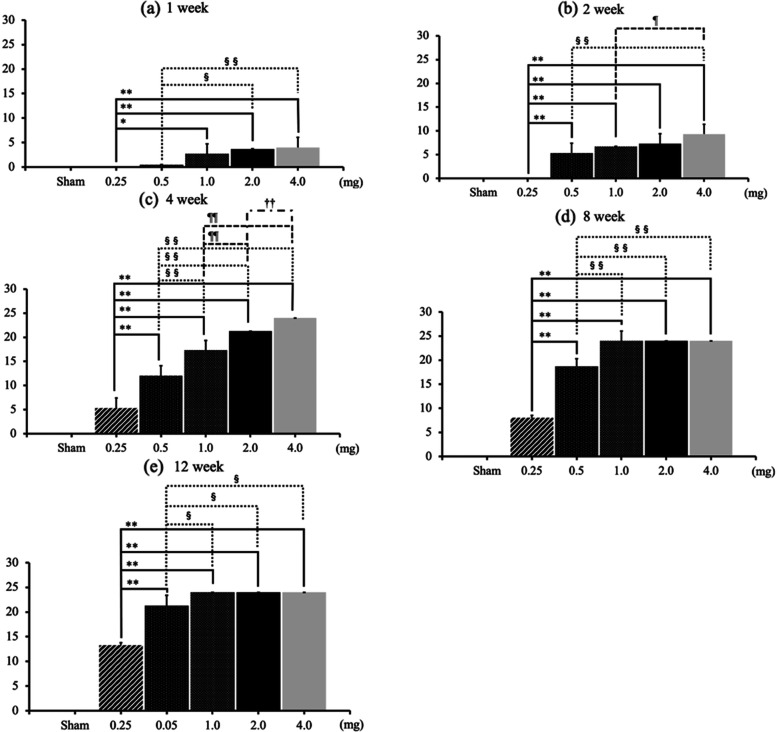
Fig. 4.
OARSI scores at each time point. a–b OARSI scores in the 4.0-mg MIA group at one and 2 weeks after MIA administration were significantly higher than those in 0.25-mg and 0.5-mg MIA groups. c In the fourth week, OARSI scores increased in a completely dose-dependent manner. d–e After the eighth week, there were no significant differences between the 1.0-mg, 2.0-mg, and 4.0-mg MIA groups. Data are presented as mean ± SEM, n = 6 rats per group. Data were analyzed using two-way ANOVA, followed by the Tukey–Kramer method. *, p < 0.05; **, p < 0.01 (vs. 0.25-mg MIA group). §, p < 0.05; §§, p < 0.01 (vs. 0.5-mg MIA group). ¶, p < 0.05; ¶¶, p < 0.01 (vs. 1.0-mg MIA group). ††, p < 0.01 (vs. 2.0-mg MIA group). Abbreviations: OARSI, Osteoarthritis Research Society International; MIA, monoiodoacetate; SEM, standard error of the mean

