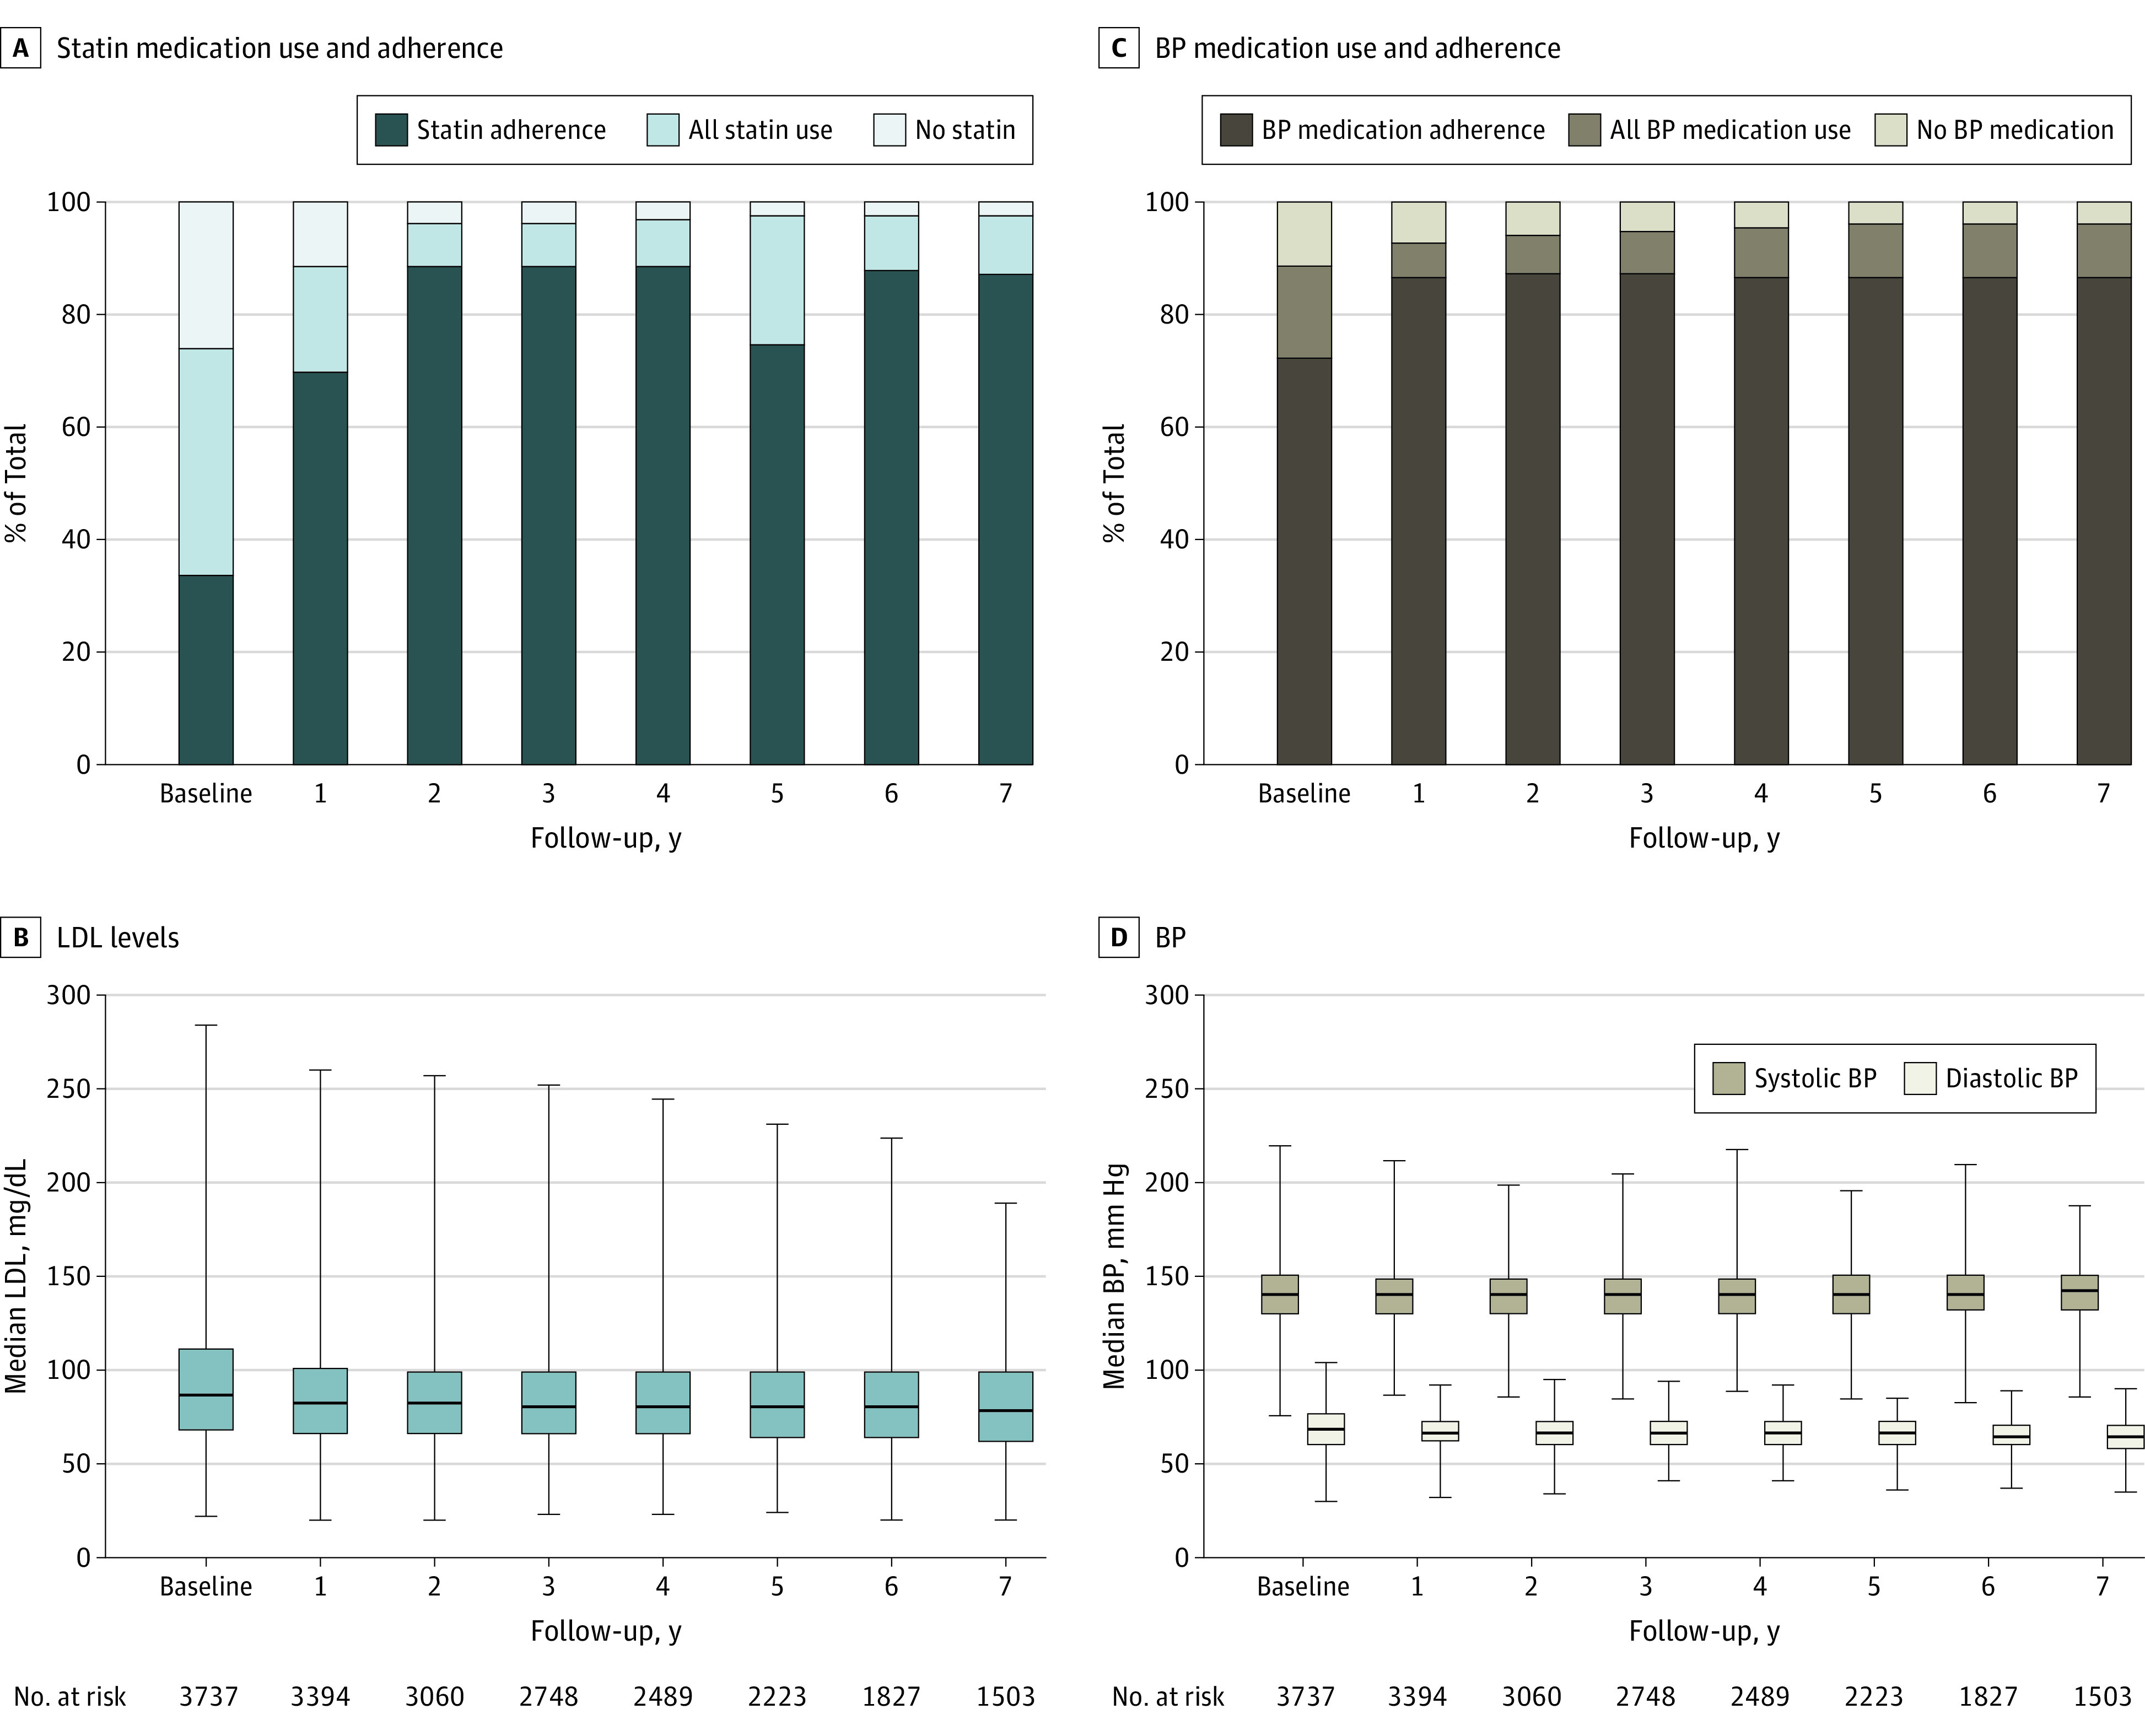
Figure 3. Per-Patient Medication Use, Adherence, and Effect Over Time.

Data are reported for baseline (year 0) and for the next 7 years.
In panels B and D, the horizontal bar in each box indicates the median, box tops and bottoms indicate the interquartile range, and the whiskers indicate the minimum and maximum (full range) values.
BP indicates blood pressure, and LDL indicates low-density lipoprotein.
