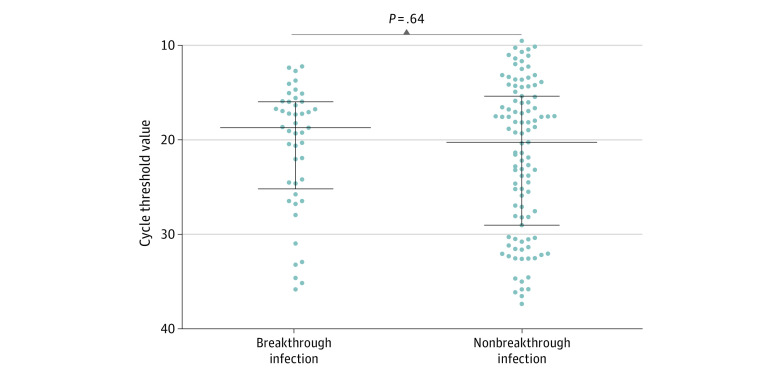
Figure 1. Cycle Threshold Values at Diagnosis in Cases of Breakthrough and Nonbreakthrough Infection in Cohort 1.
Long horizontal lines indicate the median, and short horizontal lines indicate the IQR. No significant differences were found in the median (IQR) cycle threshold value at diagnosis in cases of breakthrough infection and nonbreakthrough infection (19 [16–24] vs 20 [15–29]; P = .64).

