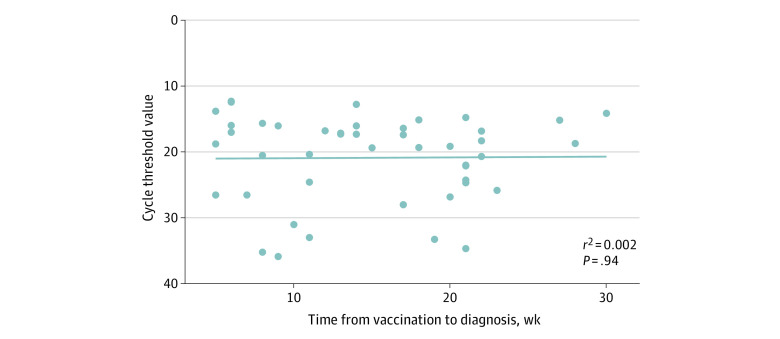
Figure 2. Association Between Cycle Threshold Value at Diagnosis and Weeks From Second Vaccination to Diagnosis.
The line represents the simple linear regression line. No significant association was found between the cycle threshold value and weeks from vaccination to diagnosis (P = .94 by linear regression).

