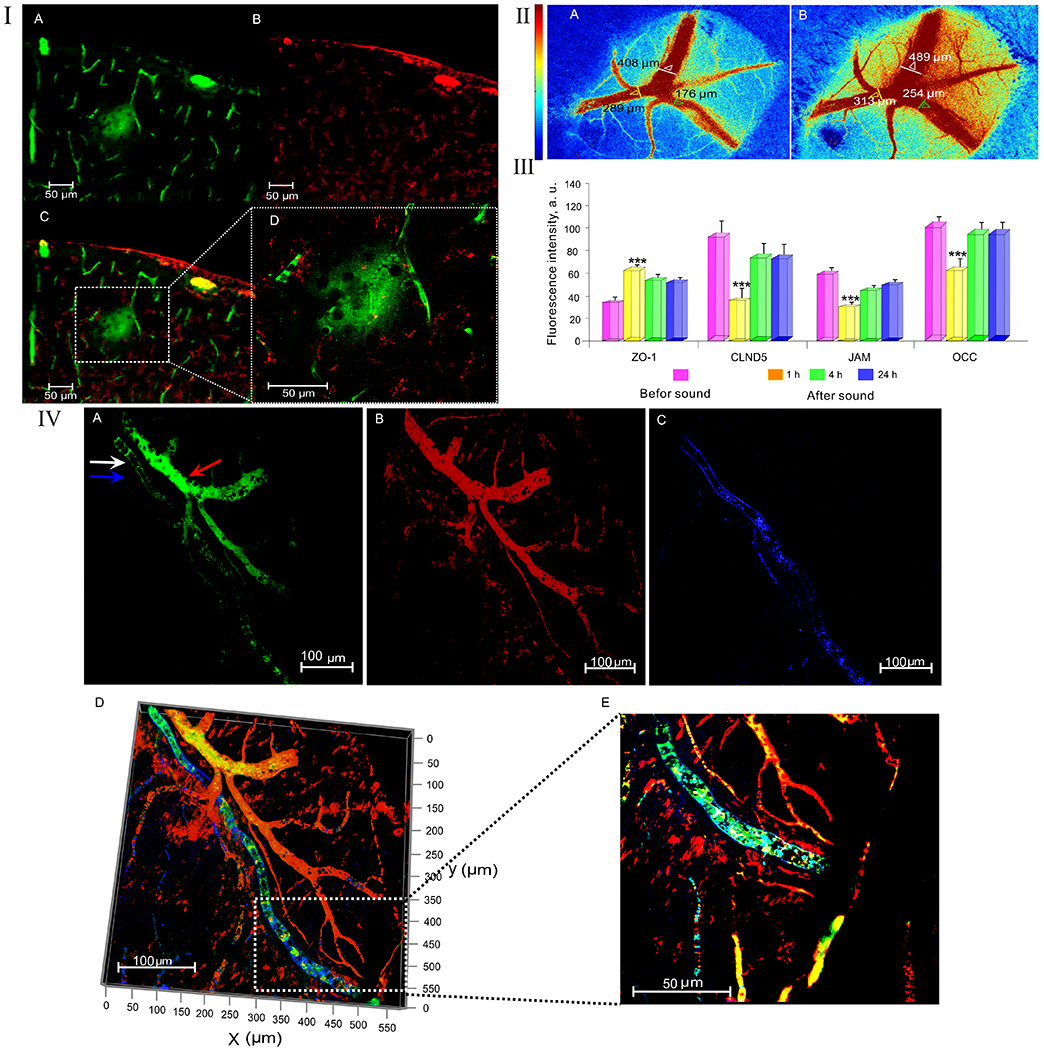
Fig. 1.

Mechanisms of the sound-induced BBB opening: I – Fluorescent microscopy of EBAC leakage before (A) and 1h after (B) sound exposure; II - Confocal microscopy of the BBB permeability to FITCD before (A-C) and 1h after sound exposure (D-G): A - FITCD is inside of the cerebral vessels (green color); B – The cerebral vessels labelled by pericyte marker NG2 (red color); C – the merged image from A and B; D - FITCD leakage presented as green fluorescence around the cerebral vessel, E – the cerebral vessels labelled by pericyte marker NG2 (red color), F – the merged image from D and E showing FITCD leakage, G – FITCD leakage at higher magnification from F; III - LSCI of rCBF before (A) and 1h after (B) sound exposure (the time of opening of the BBB); IV - The expression of TJ proteins in the control group (before sound exposure) and 1-4-24 hrs after sound impact (n=10 for each group): *** - p<0.001 vs. the control group (before sound); V - The clearance of FITCD from the brain via MLVs after its crossing the opened BBB: A – The fluorescent signal from FITDC in both anatomical positions of MLV (white arrow) and the cerebral vein (red arrow); B – the cerebral vessels (red color) labelled by NG2 (pericyte marker); C – MLV (blue color) labelled by lyve-1 (marker of lymphatic endothelium); D – the merged image from A,B,C; E – The same area at higher magnification from D.
