Figure 2.
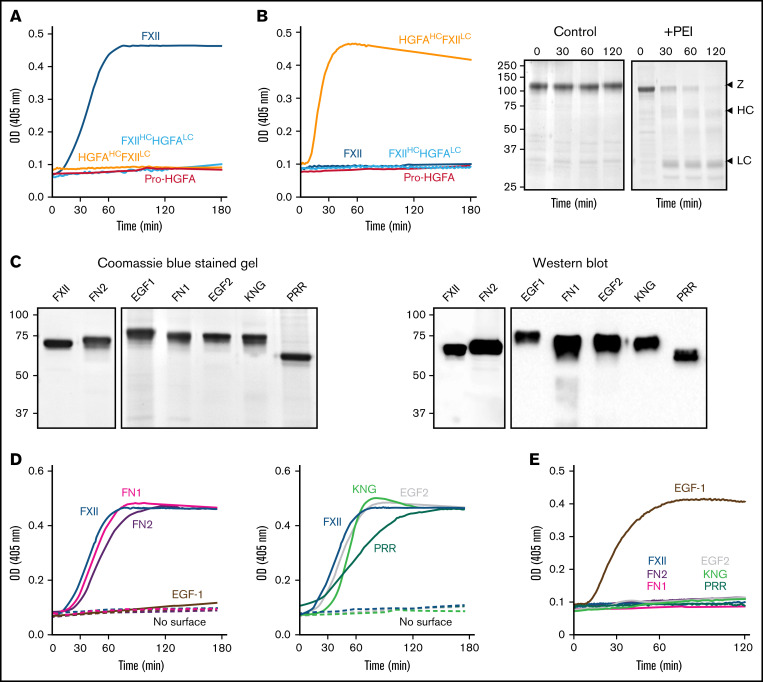
Autoactivation. (A) FXII (blue), Pro-HGFA (red), HGFAHC/FXIILC (orange), and FXIIHC/HGFALC (light blue), each 200 nM, were incubated with S-2302/S-2366 (200 μM, as described in Methods) and poly-P (70 μM). (B) Same as in panel A, except that poly-P has been replaced with 130 nM of PEI. At the right of the panel are time courses of HGFAHC/FXIILC (200 nM) incubated without (control) or with (+) 130 nM of PEI size fractionated by reducing sodium dodecyl sulfate–polyacrylamide gel electrophoresis (SDS-PAGE; 12% polyacrylamide). Positions of standards for zymogen (Z) HGFAHC/FXIILC and the heavy and light chains of HGFAHC/FXIIaLC are indicated at the right of the image. Positions of molecular mass standards in kilodaltons are shown to the left. (C) Nonreducing GelCode Blue–stained SDS-PAGE (2 μg per lane) and western blot (200 ng per lane) of purified FXII molecules containing Pro-HGFA substitutions for individual heavy chain domain (HCD; FXII-HCD chimeras). The western blot was developed with horseradish peroxidase–conjugated polyclonal goat anti-human FXII IgG. (D-E) Two hundred nanomolar FXII (blue), FXII-FN2 (purple), FXII-EGF1 (brown), FXII-FN1 (magenta), FXIII-EGF2 (gray), FXII-KNG (light green), or FXII-PRR (green) were incubated with S-2302 (200 μM) and poly-P (70 μM) (D) or PEI (130 nM) (E). Reactions without surface are indicated by the dashed lines. For panels A, B, D, and E, changes in optical density (OD) of 405 nm were continuously monitored on a spectrophotometer.

