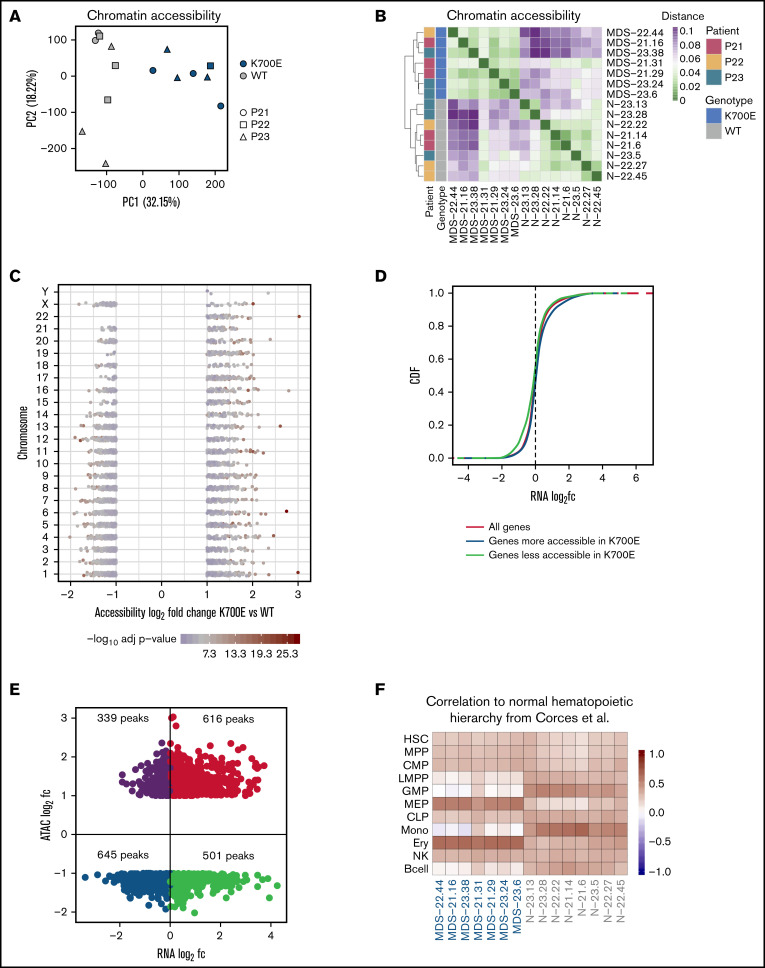
Figure 5.
SF3B1K700E HSPCs have altered chromatin landscapes. (A) PCA based on accessibility of all peaks in the ATAC-seq atlas color-coded by SF3B1 mutation status and sign-coded by patient ID. (B) Heatmap showing the distance of the HSPCs from the indicated iPSC lines, based on pairwise Pearson correlation of their chromatin accessibility landscapes, color-coded by SF3B1 mutation status and patient ID. (C) Scatterplot showing the accessibility log2fc and the adjusted P value of the differentially accessible peaks between SF3B1K700E and SF3B1WT iPSC-HSPCs per chromosome, color-coded by the adjusted P value. Each point represents a peak. (D) Cumulative distribution function (CDF) of the expression log2fc of genes more accessible in SF3B1K700E HSPCs, genes less accessible in SF3B1K700E HSPCs, and all genes, showing that genes more accessible in SF3B1K700E HSPCs are upregulated (Kolmogorov–Smirnov [KS] test, P = 1.17e-07) and genes less accessible in SF3B1K700E HSPCs are downregulated (KS test, P = 3.13e-16) compared with background. (E) Scatterplot showing the log2fc accessibility value of the differentially accessible peaks and the log2fc expression value of the linked gene (genes for which P value could not be calculated were excluded). (F) Heatmap showing Pearson correlation values of normalized read counts for ATAC-seq peaks that overlap between the indicated iPSC-HSPCs and primary normal hematopoietic cell subpopulations (hematopoietic stem cells [HSC], multipotent progenitors [MPP], common myeloid progenitors [CMP], lymphoid-primed multipotent progenitors [LMPP], granulocyte- monocyte progenitors [GMP], megakaryocyte-erythrocyte progenitors [MEP], common lymphoid progenitors [CLP], monocytes [Mono], erythroid cells [Ery], natural killer cells [NK], and B cells) from Corces et al.36

