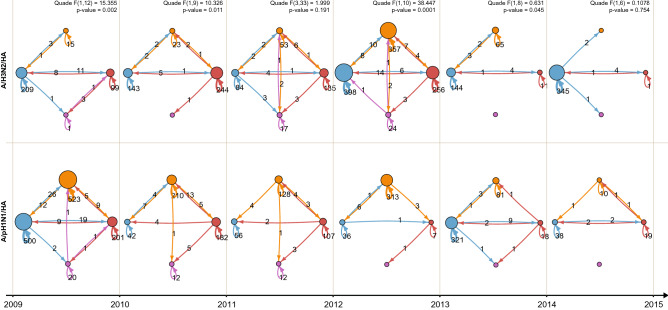
Figure 2.
Network reconstruction of viral spread between the sampled geographic locations show increased spread of influenza A/H1N1 (bottom row) compared with influenza A/H3N2 (top row) between 2009–2011, followed by an opposite trajectory between 2011–2013. Inferred viral spread networks between geographic locations are depicted between centers located in Asia (red), Europe (orange), North America (blue) and Pacific (purple). Viral spread events during a 1-year time window were pooled and numbers were shown on the arrows. The diameter of the nodes is proportional to the number of sink viral spread events, while the arrow width is proportional to the number of source spread events. The Quade test and correspondent post-hoc procedures were applied to test significant differences between spread trends and preferred viral spread trajectories are presented at the top. Significance level was set to 0.05.

