. 2022 Apr 26;13(20):6019–6027. doi: 10.1039/d2sc00918h

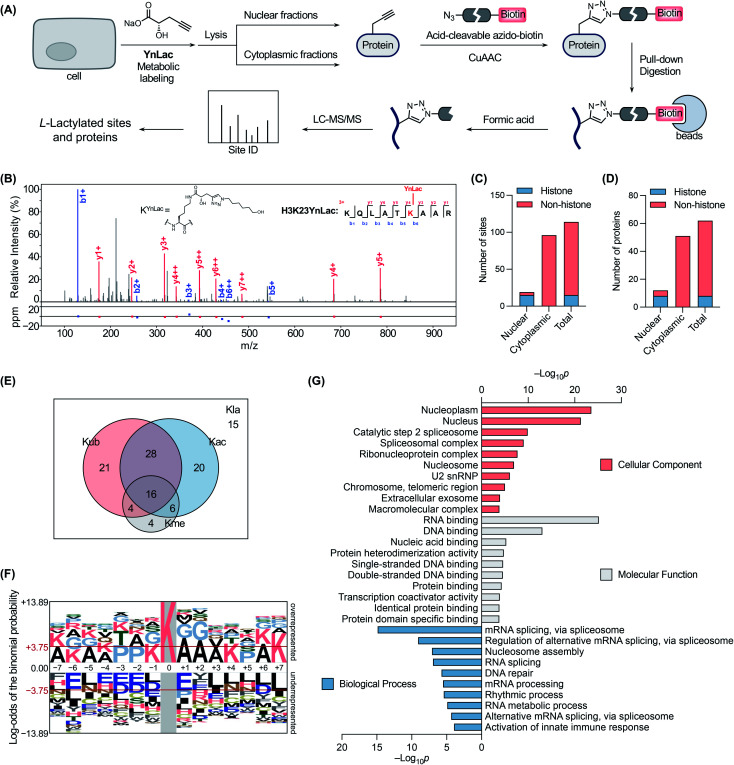
Fig. 3. Chemical proteomic profiling of protein lactylation with YnLac. (A) Workflow for the chemical proteomic profiling of lactylation sites using YnLac. HEK293T cells were metabolically labelled with YnLac and the nuclear and cytoplasmic fractions were separated for click conjugation with acid-cleavable azido-biotin and affinity pull-down. After on-bead digestion, the peptides were eluted with acid and analyzed by MS. (B) A representative MS/MS spectrum shows the identification of YnLac modification on the K23 residue of histone H3. (C) Summary of identified lactylation sites in the nuclear and cytoplasmic fractions. (D) Summary of identified lactylated proteins in the nuclear and cytoplasmic fractions. (E) The Venn diagram shows the overlap of identified lactylation sites (Kla) with three abundant types of lysine PTMs, i.e., acetylation (Kac), ubiquitination (Kub), and methylation (Kme). (F) Sequence motif analysis shows the preference of amino acid residues around the identified lactylation sites. The red horizontal lines denote thresholds of p < 0.05. (G) GO term enrichment analysis of identified lactylated proteins.

Fig. 3