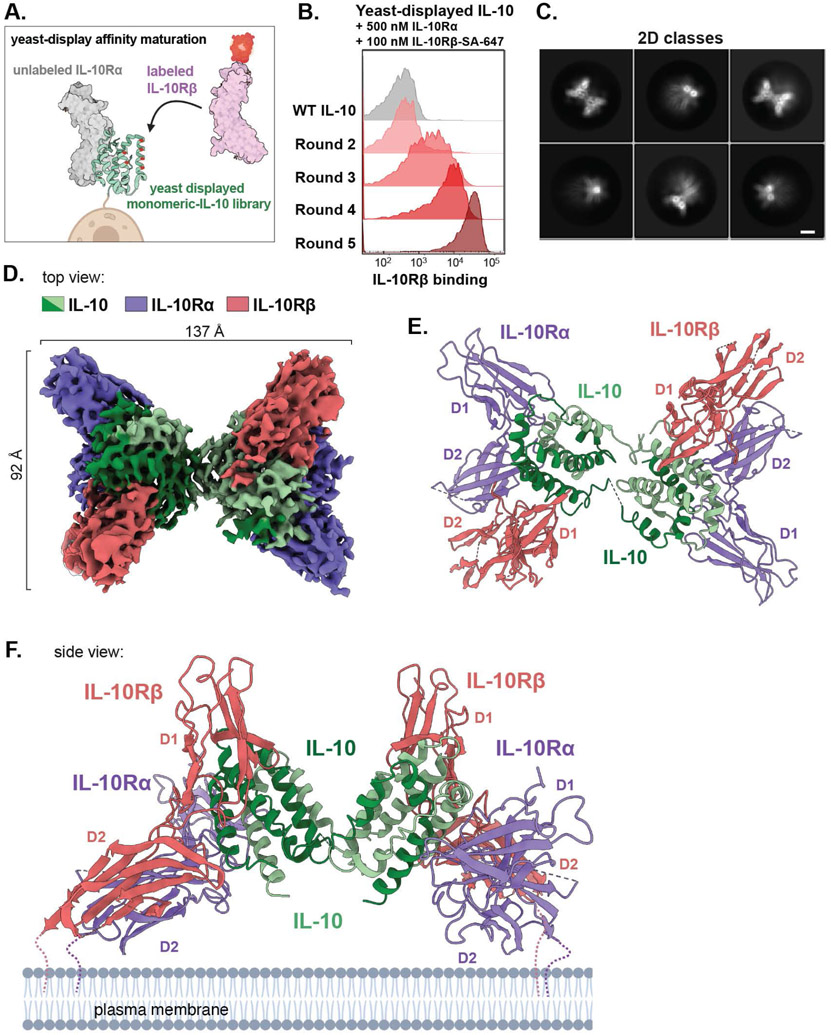
Fig. 1. Assembly and cryo-EM structure of the IL-10 signaling complex.
(A) Schematic of yeast display-based affinity maturation of IL-10. (B) Histograms of IL-10Rβ-binding by mono-IL-10 over iterative rounds of directed evolution (SA-647, Streptavidin-Alexa Fluor 647 conjugate). (C) Representative cryo-EM 2D class averages of the stabilized IL-10–IL-10Rα–IL10Rβ complex (scale bar = 5 nm). (D) Segmented density map of the IL-10 receptor complex resolved to 3.5-Å. Map threshold used in ChimeraX set to 0.25. (E, F) Top and side views of the IL-10 receptor complex with IL-10 in green, IL-10Rα in purple, and IL-10Rβ in salmon (PDB ID: 6X93).

