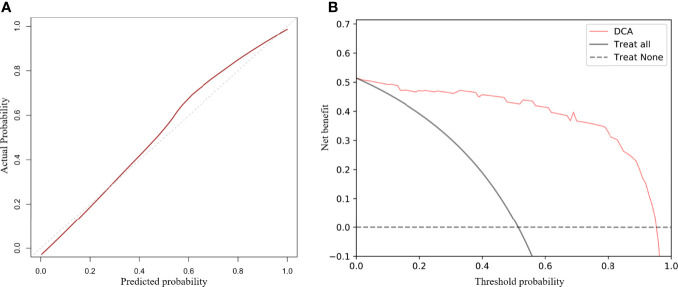
Figure 4.
Calibration curves and decision curve analysis (DCA) of the nomogram. Calibration curves for the radiomics nomogram (A). The Y-axis represents actual outcome of response to neoadjuvant chemotherapy, and the X-axis represents the predicted probability. The closer the fit of the diagonal red line to the ideal dotted line indicates the predictive accuracy of the nomogram. DCA for the radiomics nomogram (B). The Y-axis represents the net benefit. The X-axis represents the threshold probability. The net benefit of the nomogram is greater than that of the all or none scheme at a wide range of threshold probabilities.

