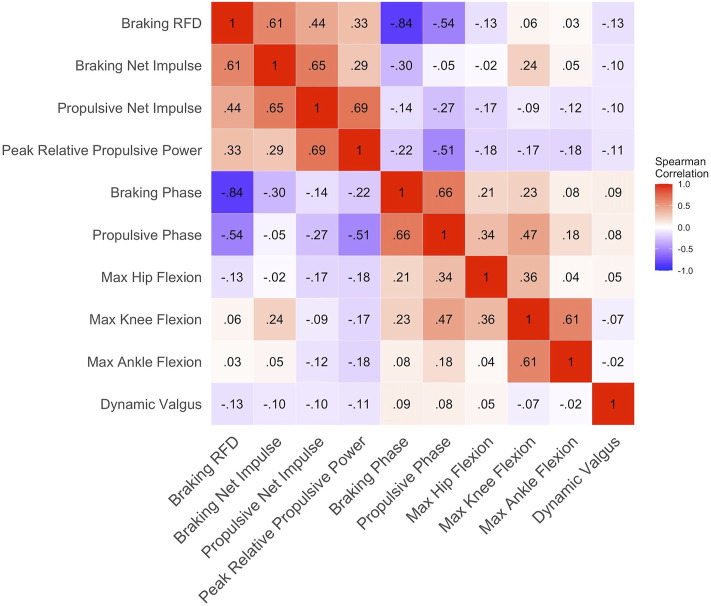
FIGURE 2.
Correlation plot on the 10 variables used for k-means clustering; r values represented by value and color representation (darker red = greater positive r values and darker blue = greater negative r values); If pairwise r values were >0.85 and <−0.85 then one variable of the pairwise variables were removed; No variables were removed.

