
Figure 2:
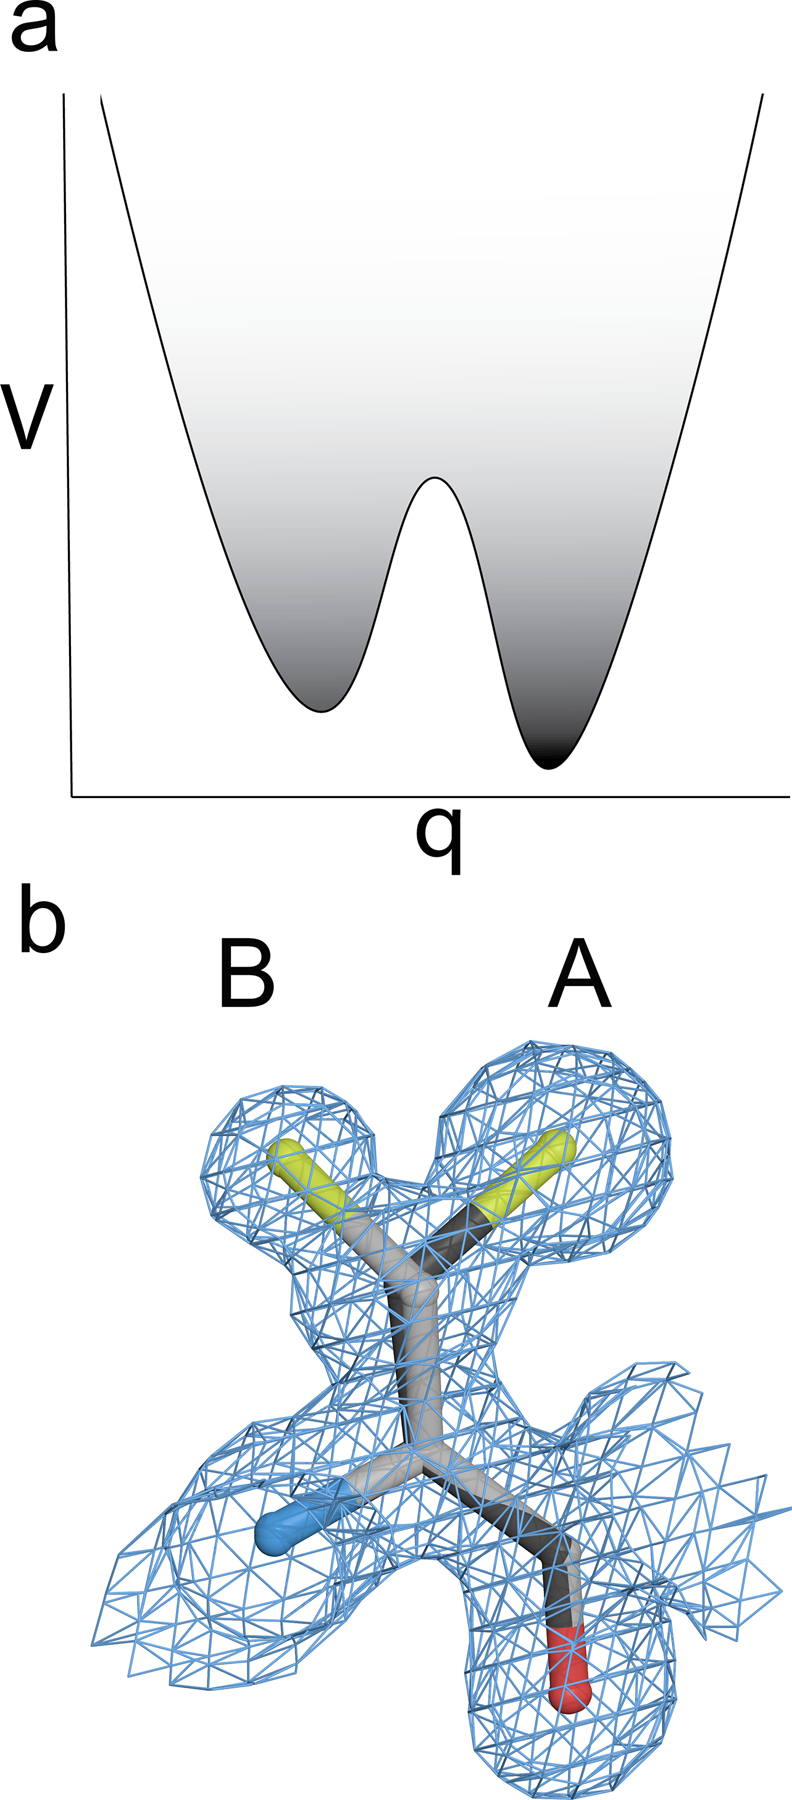
Electron density reports on multiple minima in the PES. An example of clearly multimodal density for two sidechain conformations of cysteine that indicates two distinct minima of the PES are occupied. The “A” conformer (darker line) has greater electron density, indicating that this conformer is more occupied. The greater occupancy corresponds to the “A” conformation being a deeper PES minimum, which is more darkly shaded. V is the potential energy, and q is the generalized coordinate.