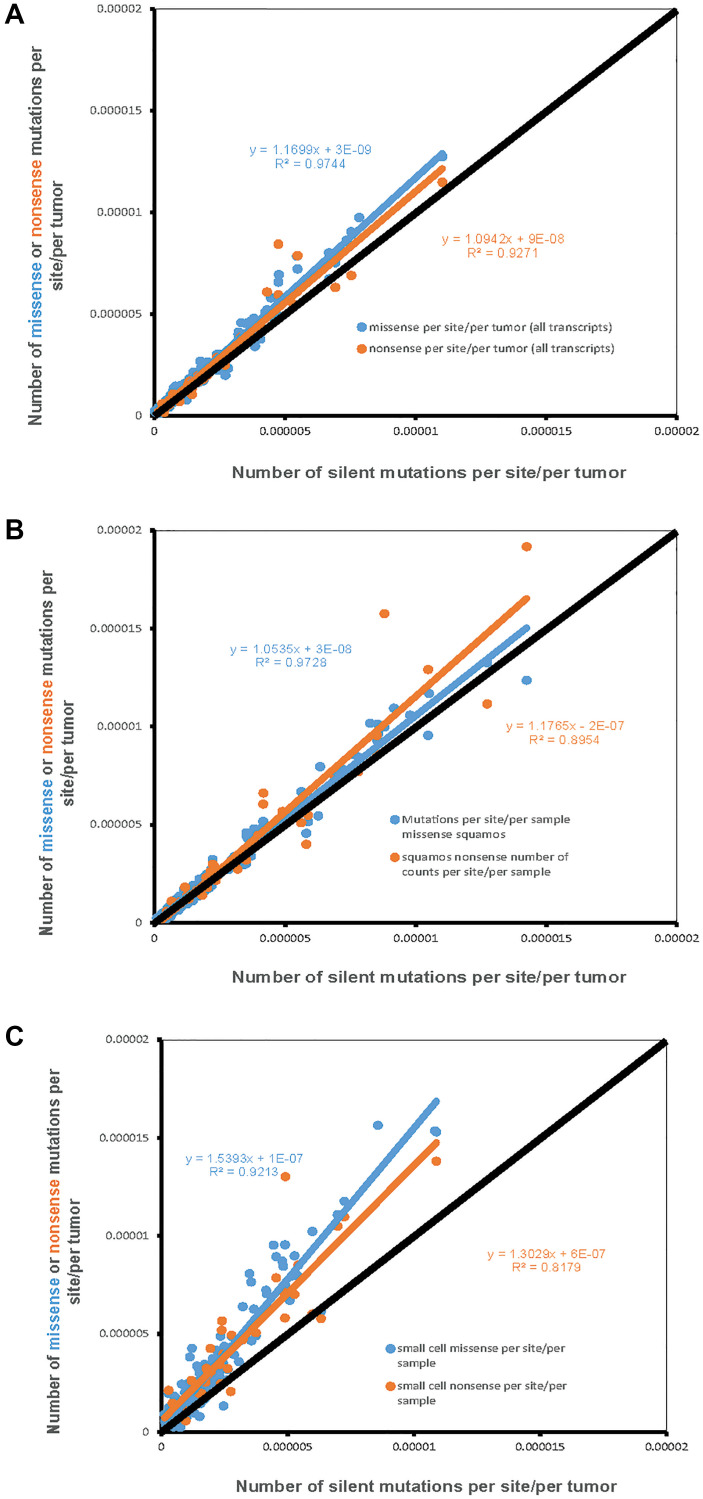
Figure 1. The number of missense and nonsense mutations per site per sample (Y-axis) compared to the number of silent mutations per site per sample (X-axis).
Each dot represents one of 192 possible nucleotide context-dependent single nucleotide substitutions (NCD-SNS). Black line represents the expected number of mutations based on the number of silent mutations (per site per sample). (A) Adenocarcinoma, (B) Squamous cell carcinoma, (C) Small cell lung cancer.

