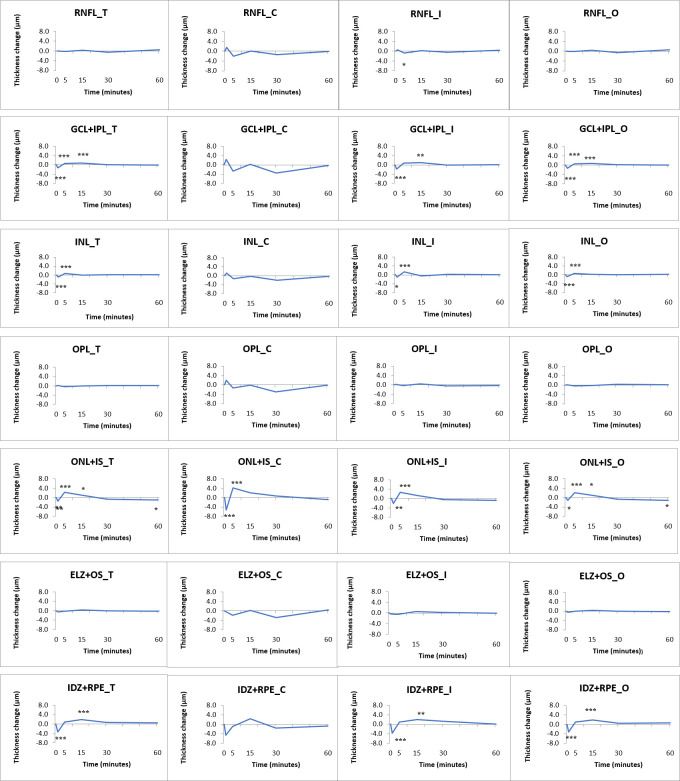
Fig 5. Changes of single retinal layer thickness over time following vita maxima strain of the study participants.
Data are shown in the total macular area (T), the central subfield (C), the inner (I) and outer ring (O). *: p <0.05 (missed significance), **: p <0.01 (missed significance), ***: p <0.001 (significant). For mean and SD values see S4 Table. (For the abbreviations of the layers see Fig 2).

