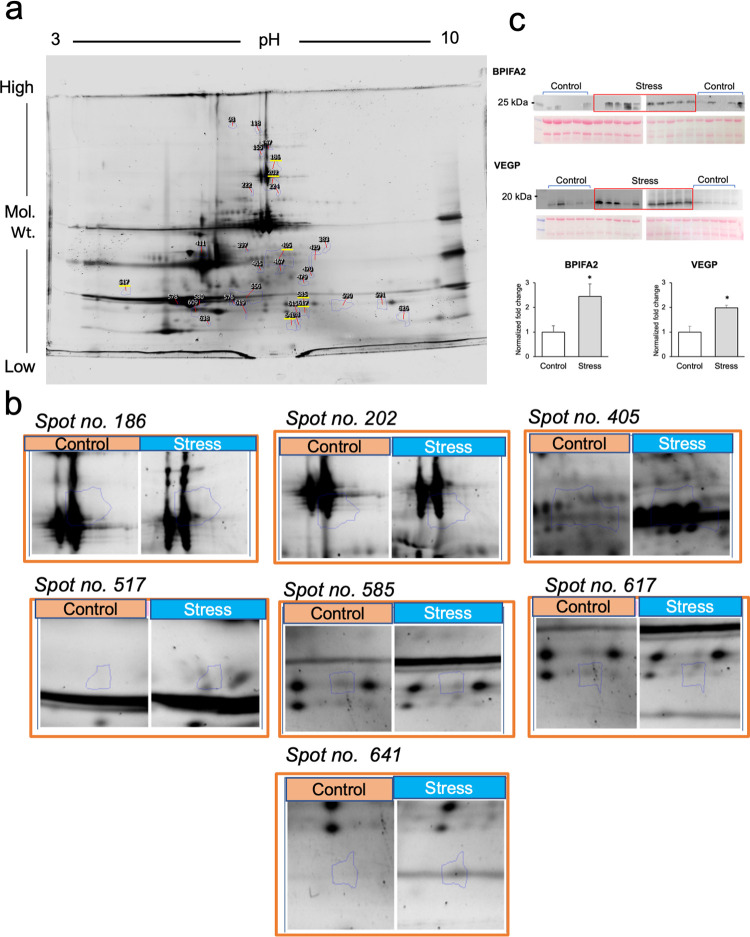
Fig 2. Identification of significantly altered protein spots in the gel and validation by Western blot analysis.
The protein spots in each gel after fluorescence staining were identified using the LuminoGraph I and ImageSaver 6 software and quantified with the Progenesis SameSpot software. Eight gels from each group were used for quantification. (a) A representative gel image showing the protein spots. The spots underlined in yellow were visible after silver staining and were selected for mass spectrometry. (b) The magnified image of the protein spots was subjected to mass spectrometry. (c) The levels of two candidate proteins, BPI fold-containing family A member 2 (BPIFA2) and von Ebner’s gland protein (VEGP) were confirmed in all samples via Western blotting. The mean intensities of the bands were significantly higher in the stress group compared to those in the controls (*p < 0.05; Mann Whitney-U test).

