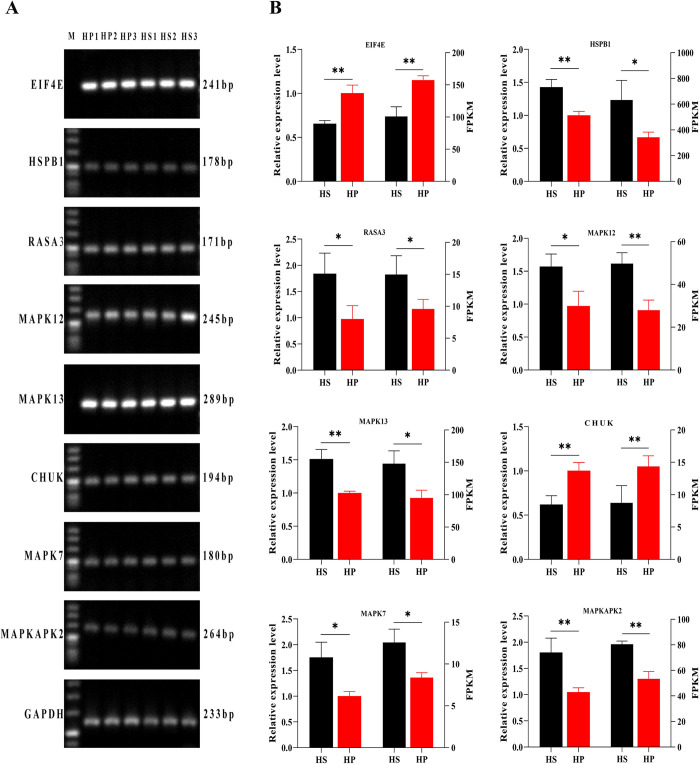
Fig 7. Eight genes selected for qPCR verification.
(A) Electropherogram of the test genes and the internal reference gene (GAPDH). (B) Eight genes for qPCR detection and RNA-seq results. The left axis of the histogram represents the gene expression level, and the right axis of the histogram represents the FPKM value of the sequencing data. HS refers to the skin in the high wool density group, and HP refers to the skin in the low wool density group. (*p < 0.05 and **p < 0.01).

