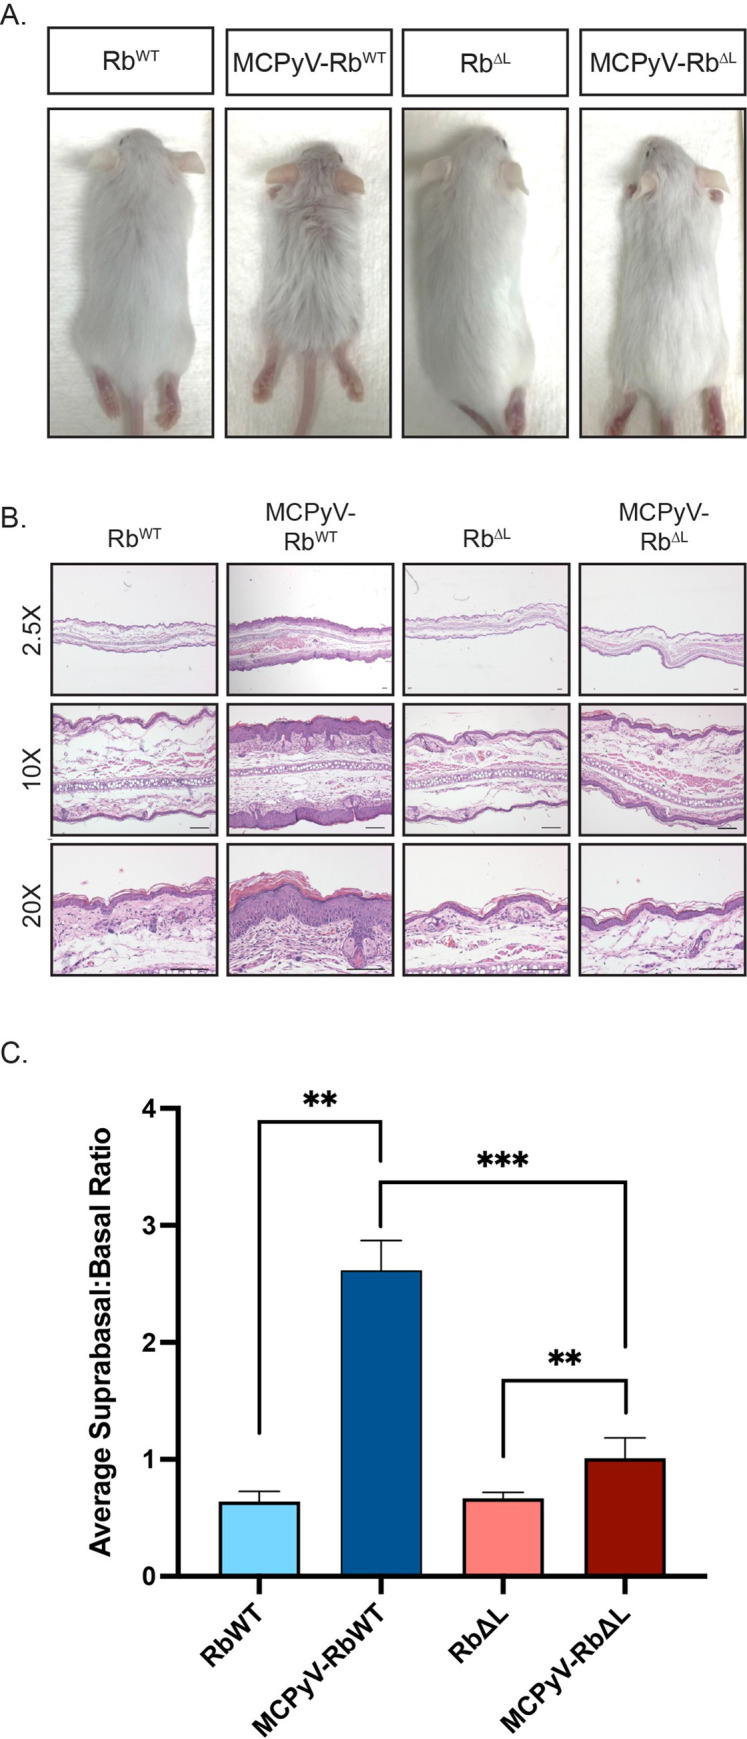
Fig 2. Overt phenotypes and epithelial hyperplasia are significantly reduced, but not eliminated, in the skin of MCPyV-RbΔL mice.

A) Representative images of RbWT, MCPyV-RbWT RbΔL, and MCPyV-RbΔL mice on a mixed genetic background at approximately 3 weeks of age. The mixed C57BL/6 and FVB/N genetic background yielded both brown and white offspring. Phenotypes were more visually apparent in white offspring, which are shown in this figure. All photographs were taken at the same distance from each subject and therefore reflect the same magnitude. B) Representative images of H&E-stained sections of ear tissue harvested from RbWT, MCPyV-RbWT RbΔL, and MCPyV-RbΔL mice are shown at low-magnification (2.5X; top) and higher magnifications (10X; middle, 20X; bottom). All scale bars = 100 μm. C) Quantification of epithelial hyperplasia in ear tissues harvested from RbWT, MCPyV-RbWT RbΔL, and MCPyV-RbΔL mice. Epithelial hyperplasia was measured by counting the total number of cells, the number of basal cells, and the number of suprabasal cells present in the stratified squamous epithelium present in a 10X field of view for each sample. The total number of suprabasal cells were then divided by the total number of basal cells to calculate the suprabasal:basal ratio. Ten-10X images were captured for each sample, analyzed using the process outlined above, and an average suprabasal:basal ratio calculated. Within each group, 5–8 mice were included and an average of the averages are plotted in the bar graph. Error bars represent standard deviation. A Wilcoxon Rank Sum test was used to compare values among groups. Asterisks indicate statistical significance (**p≤0.002, ***p≤0.0007). Please refer to the text for more information regarding statistical comparisons.
