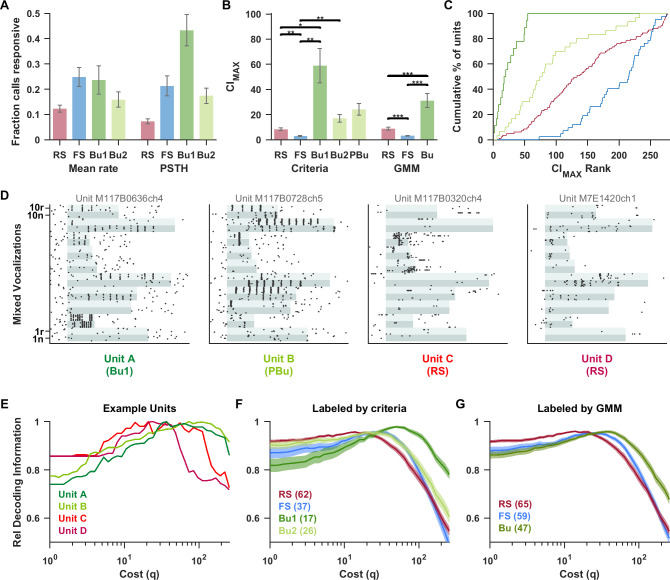
Fig 7. High-frequency bursting neurons spiked in a temporally precise manner in response to vocalizations and better supported a temporal code while RS neurons showed higher rate selectivity.
Here, we used responses to a standard “Mixed Vocalizations List” of 20 simple and compound calls (spectrograms shown in S6A Fig). (A) The fraction of call stimuli for which units had an excitatory response (as assessed by overall firing rate or for 5 ms PSTH bins (see Materials and methods). RS units had the highest vocalization selectivity. Bu1 units responded to more stimuli in terms of instantaneous rate change than overall driven rate, reflecting phase-locking. n values are RS (158), FS (50), Bu1 (18), and Bu2 (44). (B) For each unit, the maximum CI across responsive stimuli in the “Mixed Vocalizations List” was considered the CImax. Bu units had the highest CImax values, indicating that they spiked at particular times during the stimulus. The groups (“RS,” “FS,” “Bu1,” and “Bu2”) as labeled by criteria and (“RS,” “FS,” and “Bu”) as labeled by the GMM were each compared with Welch’s ANOVA and found to be highly significant (F3,48.9 = 12.5, p < 0.0005 and F2,90.5 = 22.5, p < 0.0005). “PBu” was not compared. n values for criteria-based categories are: RS (83), FS (42), Bu1 (18), Bu2 (30), PBu (58); and for GMM-based categories are: RS (86), FS (68), and Bu (54). (C) Units were ranked from highest to lowest CImax. The cumulative histogram shows that all Bu1 units had high-ranking CImax values, followed by Bu2, RS, then FS groups. (D) Examples of the vocalization responses of 2 bursting units (intraburst rates 909 and 667 Hz) and 2 RS units to the “Mixed Vocalizations List” (S6A Fig) of natural (“n”) and time-reversed (“r”) vocalization tokens. The stimulus duration is indicated with alternating aqua shading, with each band corresponding to all 10 repetitions of the given stimulus (stimuli were presented in interleaved order). We used the Victor–Purpura distance between spike trains [43] to decode the stimulus from individual trains. A cost parameter (q) was varied, spanning from rate coding to temporal coding as q is increased. (E) For the example units in (D), we calculated the transmitted information (H) of the confusion matrix as a measure of decoding quality. To better compare the effect of changing q, H is normalized by its maximum value for each unit. The 2 precise bursting units had a higher optimal q range than the RS units. At q = 1, where decoding is close to a rate code, the RS units performed well relative to the bursting units. In contrast, at high q values, decoding performance of RS units falls off steeply while that of high-frequency Bu units persisted. Similar trends are seen for the average of all units labeled by criteria (F) and by the GMM (G). Data underlying this figure can be found in S1 Data. Bu, bursting; CI, correlation index; FS, fast-spiking; GMM, Gaussian mixture model; PSTH, peristimulus time histogram; RS, regular-spiking.

