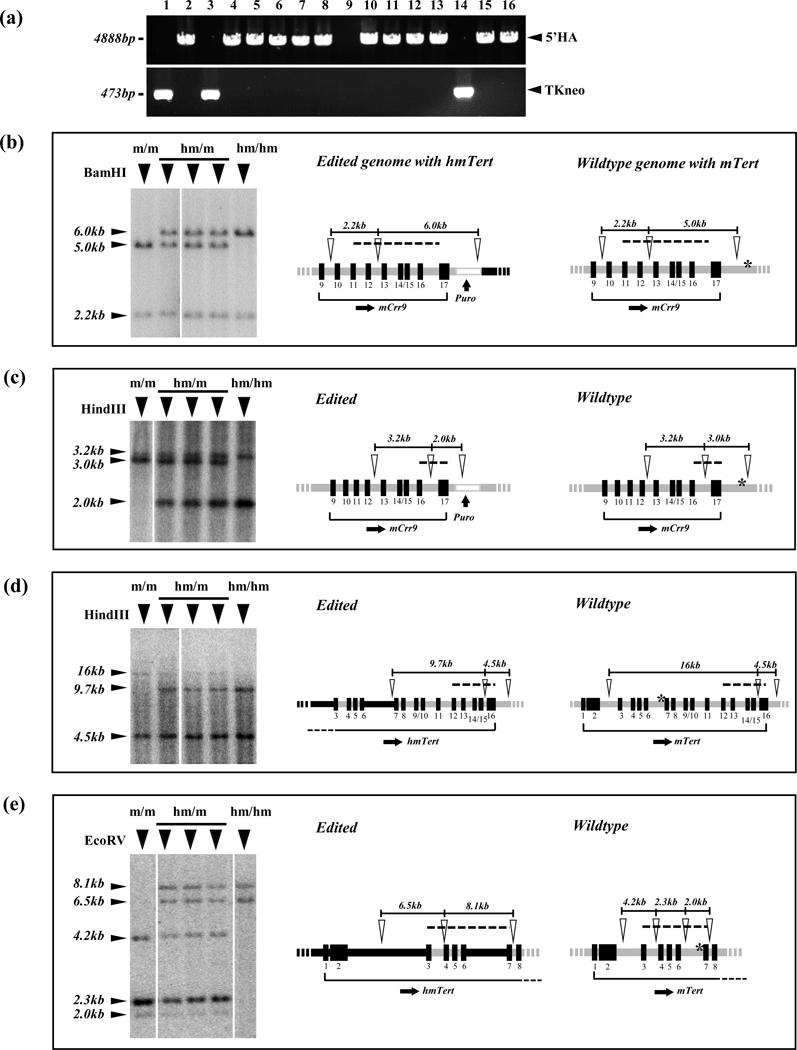
FIGURE 3.
Characterization of hmTert loci in mESC clones. (a) Identification of mESC clones with hmTert loci by PCR. The occurrence of 5’ HR was detected by the presence of a 4888-bp PCR band using a pair of primers just outside of 5’ HA. The presence of TKneo marker was indicated by a 473-bp PCR band using primers within the TKneo cassette. (b-e) Characterization of hmTert alleles by Southern analyses. Genomic DNAs (2 μg) from individual mESC clones were digested by BamHI (b), HindIII (c, d) and EcoRV (e), and hybridized with P32-labeled DNA probes, A (b), B (c), C (d), and D (e), respectively (Table S2). Left panels show Southern blot images and band sizes are indicated on the left. Genotypes: m/m, mTert/mTert; hm/m, hmTert/mTert; hm/hm, hmTert/hmTert. Diagrams on the right show schematic illustrations of edited and wildtype genomes with hmTert and mTert alleles, respectively. Open arrowheads indicate restriction enzyme sites and dash lines specify regions covered by DNA probes. Black rectangles with numbers below denote exons. Black and gray horizontal lines indicate human and mouse noncoding sequences, respectively. Asterisks (*) indicate sgRNAs cleavage sites.

