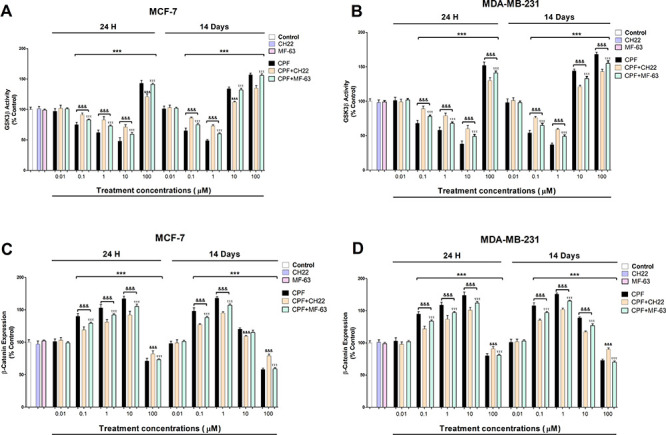
Figure 3.

GSK3β (A and B) activity and β-catenin (C and D) expression analysis results. Data represent the mean ± SEM of three separate experiments from cells of different cultures, each performed in triplicate. ***p ≤ 0.001, significantly different from controls; &&&p ≤ 0.001 compared to CPF treatment.
