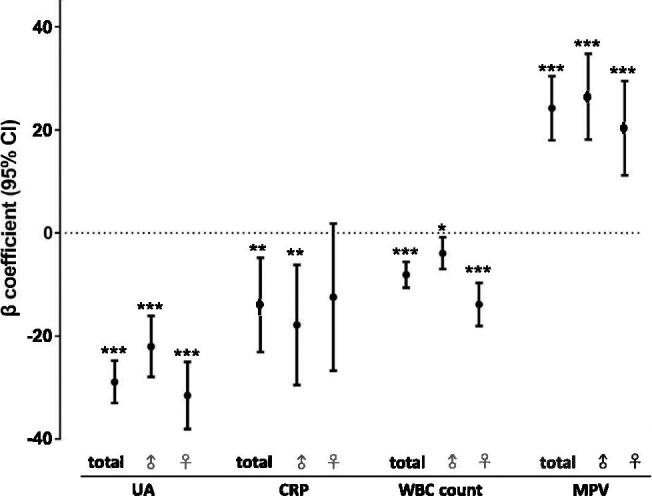
Figure 2.

Forest plot of the β coefficients for the associations between inflammatory biomarkers and serum klotho levels in total cohort, men, and women. Linear regression was used to analyse the association between UA, CRP, WBC count, MPV and serum klotho levels. The β coefficient presents the degree of change in the serum klotho level for every 1-unit of change in the predictor variable. *p<.05, **p<.01, ***p<.001. UA: uric acid; CRP: C-reactive protein; WBC count: white blood cell count; MPV: mean platelet volume
