
Figure 2.
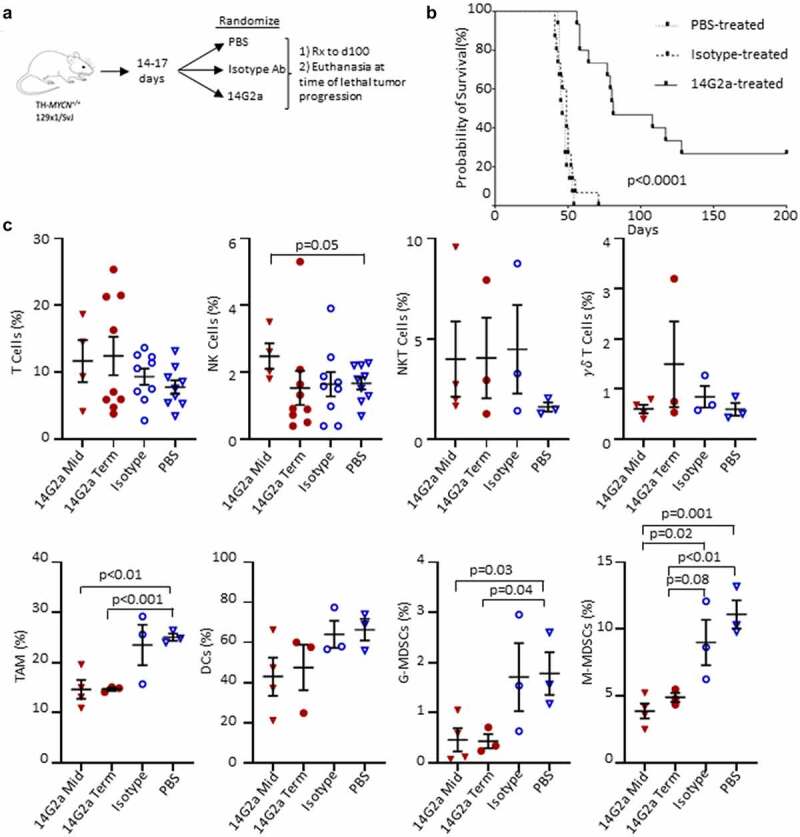
Experimental summary and survival of TH-MYCN+/+ mice and immune cells in the tumor microenvironment. (a) Transgenic TH-MYCN+/+mice were enrolled into 3 treatment groups: PBS, 14G2a, and Isotype. Mice were treated with intraperitoneal (IP) injections twice weekly until death or significant morbidity, and then had tumors isolated in terminal surgeries. (b) Kaplan–Meier survival curve shown by treatment group. 4 mice living at day 200 in the 14G2a-treated group were censored for re-challenge with flank implantation of a TH-MYCN-derived neuroblastoma cell line. Log-rank (Mantel-Cox) test was used to compare survival curves with significance set as p < .05. (c) TH-MYCN+/+ neuroblastoma tumors were isolated from 14G2a midpoint (Mid), 14G2a terminal (Term), Isotype, and PBS treatment groups. Single cell suspensions of tumors were immunostained with fluorescent antibodies specific for markers of T, natural killer (NK), natural killer T (NKT), and gamma delta (γδ) T cells, in addition to markers for tumor associated macrophage (TAM), dendritic cells (DCs), granulocytic myeloid-derived suppressor cells (G-MDSCs) and monocytic myeloid-derived suppressor cells (M-MDSCs). Specified cell frequencies are reported as a percentage of single, live, CD45+ parent populations, by treatment group. Groups were compared with two-tailed Student’s t-test with significance set as p ≤ .05 (trend p ≤ .10).