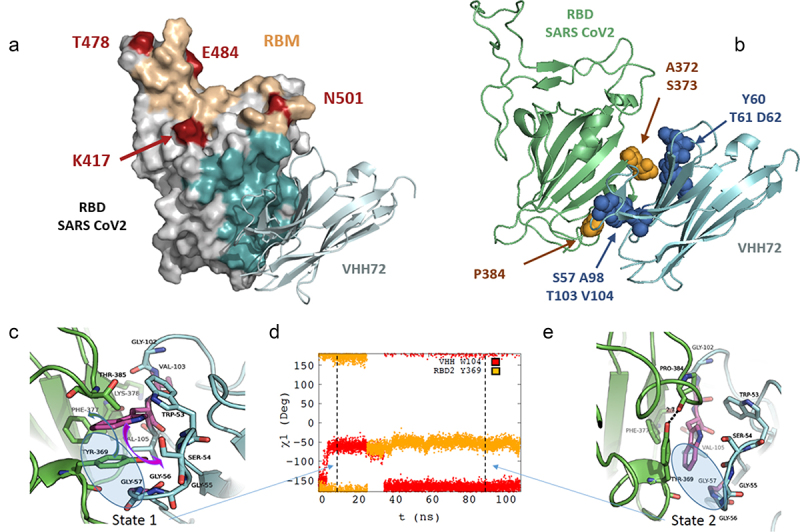
Figure 6.
Molecular modelling of the interaction between VHH-72 harbouring substitutions S57G/T103V/V104W with SARS-CoV-2 RBD. (a) Homology model of interaction between VHH72 with substitutions S57G/T103V/V104W and SARS-CoV-2 RBD domain. Amino acid substitutions present in the different SARS-CoV-2 variants of concern (VOCs) are shown in red. RBD amino acids within 4.5 Å of any VHH-72 atom were defined as the epitope and stained cyan. Residues included in the receptor binding motif (RBM) are shown in sand color. (b) Location of residues in the epitope of the VHH72 that diverge from SARS-CoV-2 and SARS-CoV-1 (in Orange). Amino acid positions for which substitutions are present in our selected variants are shown in blue. (c), (e) Representative structures extracted from the MD simulation of the SARS-COV-2 RBD – VHH72 complex for state 1 (c) and state 2 (e). The main chains of the proteins are shown in cartoon representation colored in green for SARS CoV-2 RBD and in cyan for VHH72 with the exception of residues G57, V103 and W104 colored in purple. Important residues for the interaction between the two proteins are shown in stick representation coloured by element. In Figure 6c, the movements of residues SARS-CoV-2 RBD Y369 and VHH72 W104 are shown using coloured arrows (green for SARS Cov2 RBD Y369 and purple for VHH72 W104). The χ1 monitored along the MD simulation are shown in (d) for residues W104 (in red) of VHH72 and Y369 (in Orange).
Alt Text: Molecular modeling of the interaction between VHH-72 harboring substitutions S57G/T103V/V104W with SARS-CoV-2 RBD. (a) Three-dimensional model of SARS-CoV-2 RBD domain in interaction with VHH72 with substitutions S57G/T103V/V104W. The epitope is distal from the ACE2 receptor-binding interface. (b) Three-dimensional model indicating that residues mutated in selected variants are in the vicinity of polymorphic positions diverging from SARS-CoV-2 and SARS-CoV-1 within the epitope. (c), (e) Representative three-dimensional structures extracted from the MD simulation of the SARS-COV-2 RBD – VHH72 complex for state 1 and state 2. Residues SARS-CoV-2 RBD Y369 and VHH72 W104 are moving during the course of the modeling trajectory. (d) Graphical representation representing the χ1 angle in degree monitored along the MD simulation for residues W104 (in red) of VHH72 and Y369 (in orange) during the course of the modeling trajectory.

