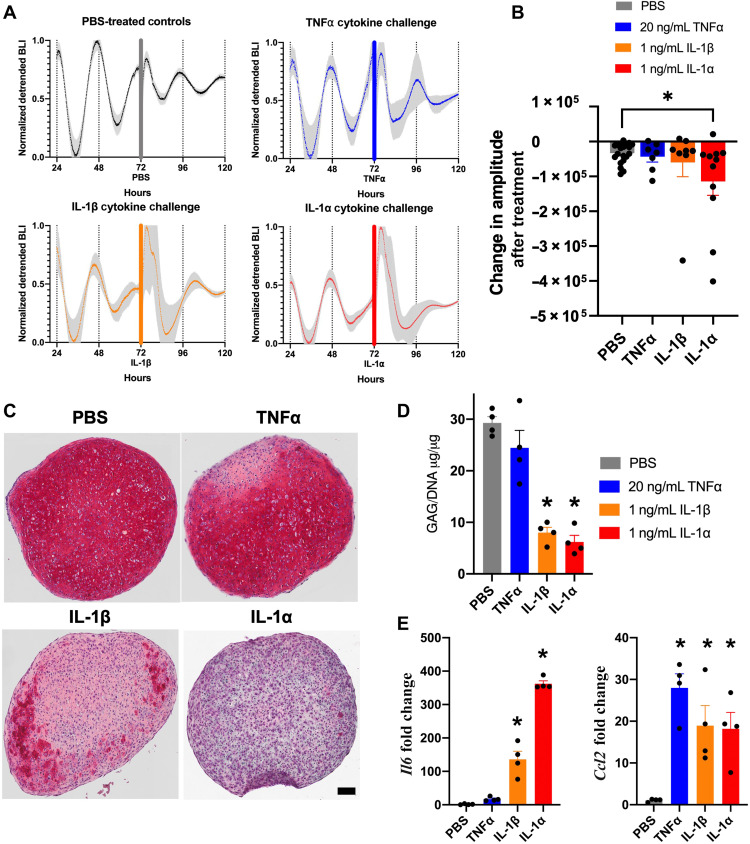
Fig. 3. Tissue-engineered cartilage response to inflammatory cytokines.
(A) P2L bioluminescence traces of pellets pre and post cytokine [TNFα (n = 7), IL-1β (n = 8), IL-1α (n = 11), or PBS (n = 20)]. Tissue-engineered cartilage pellets were treated with TNFα, IL-1β, IL-1α, or PBS control for 72 hours. Bars show addition of cytokine or PBS control. Shaded region on graphs represents SEM. (B) P2L pellets treated with IL-1α show rapid decrease in bioluminescence followed by lower-amplitude circadian rhythm (P = 0.037). The amplitude due to treatment was quantified by measuring the difference in peak-trough amplitude 24 hours before and 48 hours following treatment. Asterisks represent significance compared with PBS control. (C) Safranin O staining for sGAGs (n = 4 per treatment; scale bar, 100 μM). Pellets treated with IL-1β and IL-1α show loss in stain. (D) Quantification of sGAGs normalized to DNA content within each pellet (n = 4 per treatment). Pellets treated with IL-1β and IL-1α show significant loss in sGAG compared with PBS controls (P < 0.0001). Asterisks represent significant differences as compared with PBS controls. (E) Gene expression analysis of Il6 and Ccl2 (n = 4 per treatment, fold change relative to PBS control). Only IL-1β and IL-1α treatment caused up-regulation of Il6 (P = 0.0002). All cytokine treatments caused up-regulation in Ccl2 (P < 0.05). Asterisks represent significant differences as compared with PBS controls.

