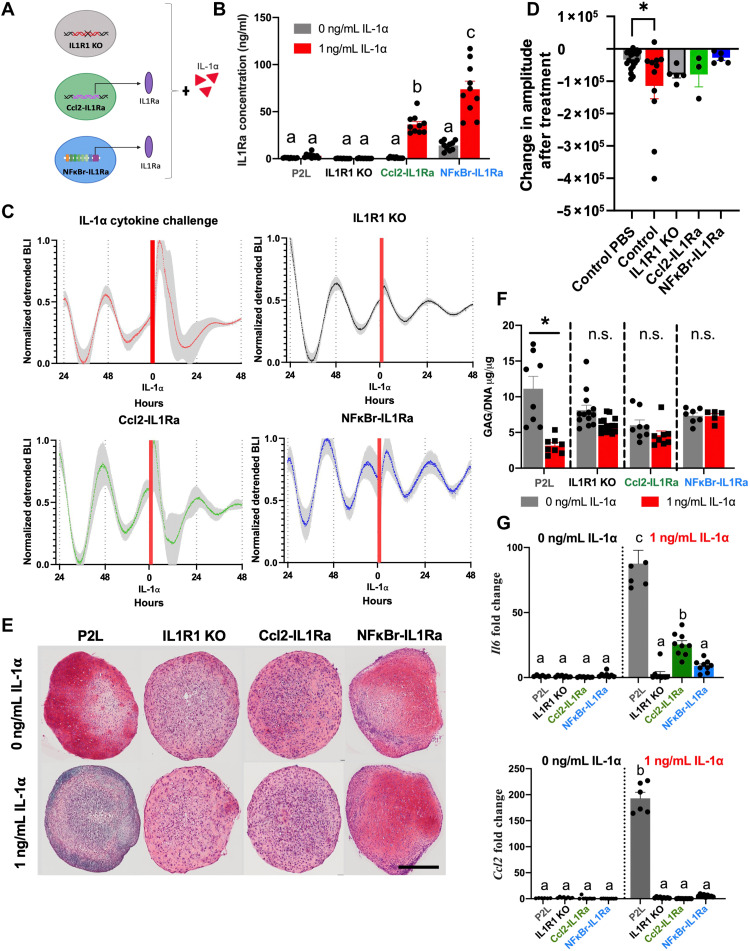
Fig. 5. Engineered cell therapy response to IL-1α.
(A) Three different anti-inflammatory cell therapies expressing a P2L reporter were used to test the ability to protect the circadian rhythm of tissue-engineered cartilage: CRISPR-Cas9–edited miPSCs lacking the IL-1R (IL1R1 KO), CRISPR-Cas9–edited miPSCs that produce IL-1Ra downstream of the Ccl2 promoter (Ccl2-IL1Ra), and a lentiviral gene therapy composed of an NF-κB–responsive synthetic promoter that drives production of IL-1Ra (NFκBr-IL1Ra). (B) IL-1Ra concentration in response to IL-1α stimulation (n = 10 per group). The Ccl2-IL1Ra and NFκBr-IL1Ra groups showed increased IL-1Ra production in response to IL-1α. Different letters denote groups that are significantly different. b compared to a (P < 0.002), c compared to a or b (P < 0.0001). (C) P2L bioluminescence traces of pellets before and after cytokine (n = 13). All three cell therapy groups showed protection of the clock from IL-1–induced detrimental effects. Red bar represents addition of IL-1⍺. Shaded region on graph represents SEM. (D) Change in amplitude due to treatment was quantified by measuring the difference in peak-trough amplitude 24 hours before and 48 hours following treatment and was similar to normal damping of rhythms observed in PBS-treated samples. (E) Safranin O staining for sGAGs (n = 4 to 6 per group; scale bar, 100 μM). (F) Quantification of sGAGs normalized to DNA content within each pellet (n = 8 to 10 per treatment). Cell therapy groups showed no significant loss in sGAG in response to IL-1α. Asterisks denote the significance compared to PBS control within group. n.s., not significant. (G) Gene expression analysis of Il6 and Ccl2 (n = 6 to 8 per group fold change relative to P2L-untreated control). All cell therapy groups showed significantly less inflammatory gene expression compared with IL-1α–treated controls. Different letters denote groups that are significantly different. For Il6, b compared to a (P < 0.0045), and c compared to a or b (P < 0.0001). For Ccl2, b compared to a (P < 0.0001).

