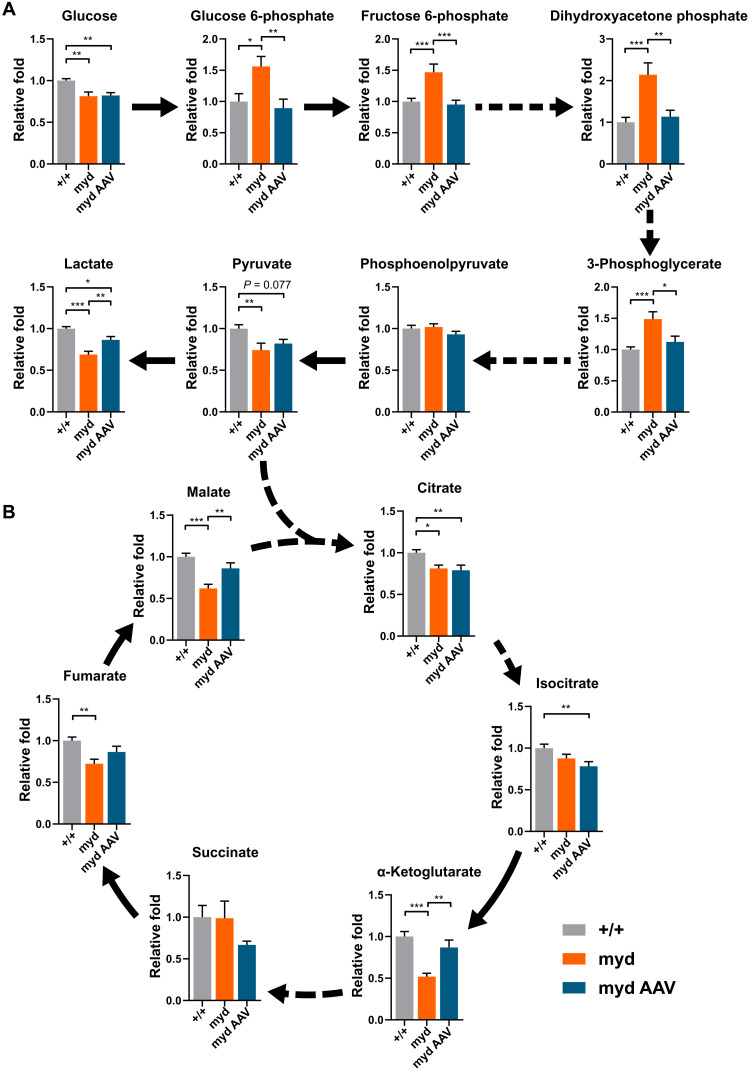
Fig. 4. Large1 is required for normal glycolytic and TCA cycle plasma profiles.
Relative fold change of plasma: (A) glycolytic and (B) intermediate TCA cycle metabolites from Large+/+ (+/+; gray bars, n = 11), untreated myd (myd; orange bars, n = 7), and myd mice treated with AAVLarge1 (myd AAV; blue bars, n = 6); solid and dashed arrows represent single and multiple metabolic reactions, respectively; *P < 0.05, **P < 0.01, and ***P < 0.001. Analysis by ordinary one-way analysis of variance (ANOVA) followed by post hoc Tukey’s multiple comparison test. Data presented as means ± SEM.

