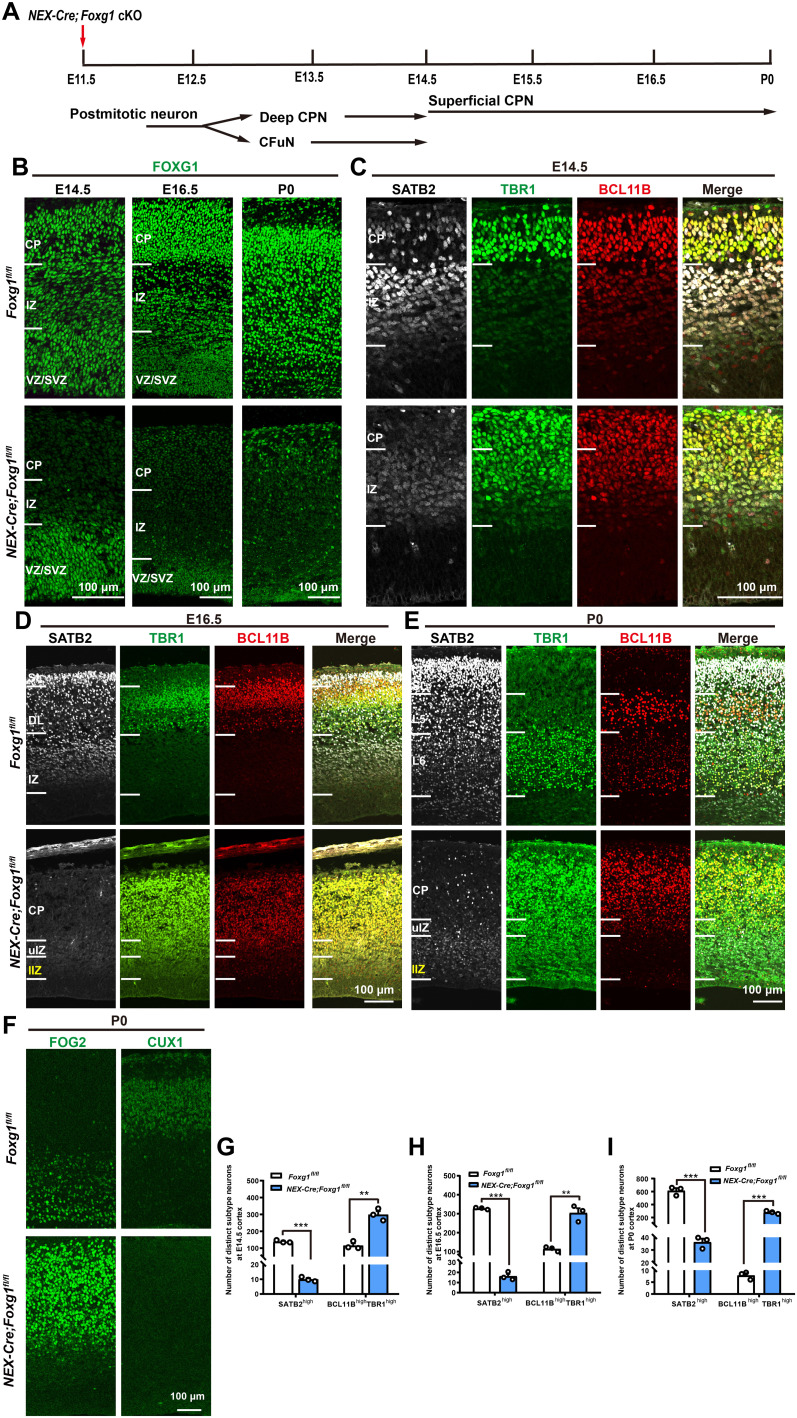
Fig. 1. Deletion of Foxg1 from E11.5 onward leads to lost CPN identity and an arrested CFuN state.
(A) Schematic of Foxg1 disruption strategy in postmitotic neurons at E11.5. (B) Immunostaining showing that FOXG1 was efficiently disrupted. (C) Triple immunostaining against SATB2, TBR1, and BCL11B at E14.5, revealing markedly decreased SATB2 levels at the CP and IZ, and increased levels of BCL11B and TBR1 in NEX-Cre;Foxg1 cKO IZ. (D) Triple immunostaining against SATB2, TBR1, and BCL11B at E16.5, showing that the NEX-Cre;Foxg1 cKO cortex has many neurons expressing low SATB2 levels in the IZ. The whole CP and upper IZ were all occupied with TBR1highBCL11Bhigh neurons. In the lower IZ, TBR1 but not BCL11B levels were increased in NEX-Cre;Foxg1 cKO mice. (E) Triple immunostaining against SATB2, TBR1, and BCL11B at P0 showing that in the NEX-Cre;Foxg1 cKO cortex, few SATB2high CPNs were detected and that most postmitotic neurons in the CP were arrested at the TBR1highBCL11Bhigh CFuN stage. In IZ, TBR1 but not BCL11B was obviously up-regulated in SATB2low superficial CPNs. (F) Immunostaining against FOG2 and CUX1 at P0, showing that the level of FOG2 was increased while the CUX1 level was remarkably reduced in the CP of NEX-Cre;Foxg1 cKO mice. (G to I) Quantitative analysis showing a reduction in SATB2high CPNs but an increase in BCL11BhighTBR1high CFuNs at E14.5 (G), a remarkable reduction in SATB2high CPNs yet an increase in BCL11BhighTBR1high CFuNs at E16.5 (H), and reduced SATB2high CPN numbers but increased BCL11BhighTBR1high CFuN numbers at P0 (I). Data are presented as means ± SEM; n = 3, multiple Student’s t test with Bonferroni correction. **P < 0.01; ***P < 0.001. uIZ, upper intermediate zone; lIZ, lower intermediate zone; VZ, ventricular zone; SVZ, subventricular zone; DL, deep layer; SL, superficial layer.

