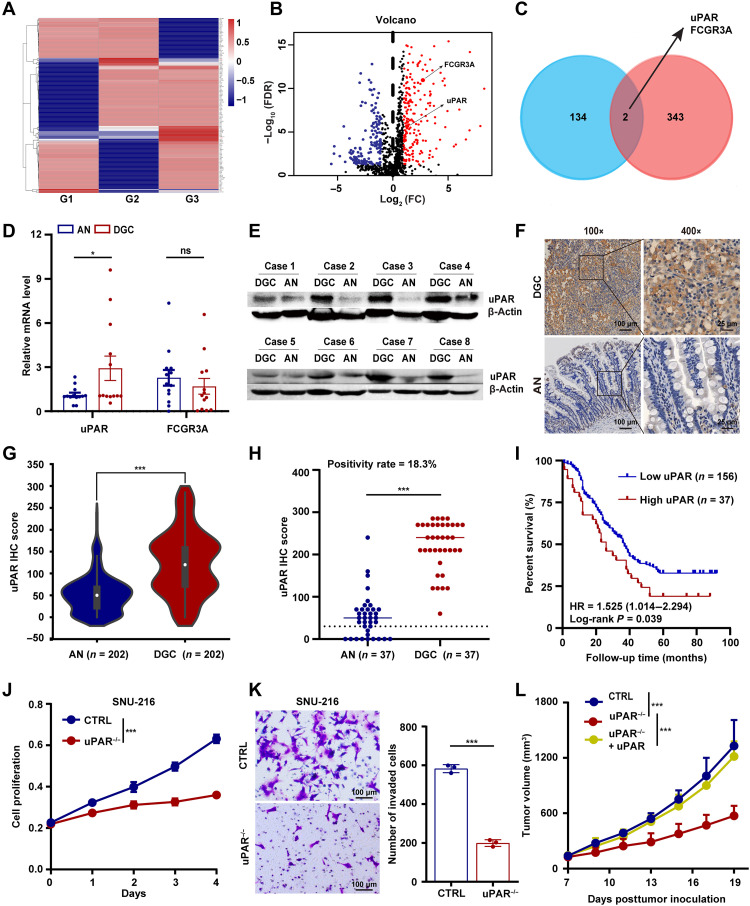
Fig. 1. uPAR is overexpressed in DGC and is a potential therapeutic target.
(A) Heat map showing membrane protein expression specifically detected in the tumors but not in the adjacent normal tissues of patients with DGC (n = 5 per group, 3 groups: G1 to G3). (B) Volcano plot of immune-related genes in GC. FDR, false discovery rate; FC, fold change. (C) Venn diagram showing the overlap between (A) and (B). (D) mRNA expression of uPAR and FCGR3A in patients with DGC (n = 13) detected by qRT-PCR. AN, adjacent normal tissues. (E) Immunoblotting of uPAR in the tumor and corresponding adjacent normal tissues from patients with DGC (n = 8). (F and G) uPAR protein level detected by tissue microarrays (TMAs)–based immunohistochemistry (IHC). Representative images of uPAR staining (F) and the statistical analysis of uPAR IHC score (G) of 202 DGC specimens obtained from 623 GC cases. (H) uPAR positivity rate in patients with DGC (37 of 202) defined by IHC score of 3+ with ≥10% of the cells showing positive reactivity. (I) Kaplan-Meier plot of the DGC patient OS. (J and K) Growth curves (J) and transwell invasion assay (K) of SNU-216 control (CTRL) and uPAR−/− cells. (L) Tumor growth curves of NSG mice carrying wild-type, uPAR−/−, or uPAR−/− complemented with uPAR MKN-45 CDXs. Data are expressed as the means ± SEM (ns, nonsignificant; *P < 0.01 and ***P < 0.001).

