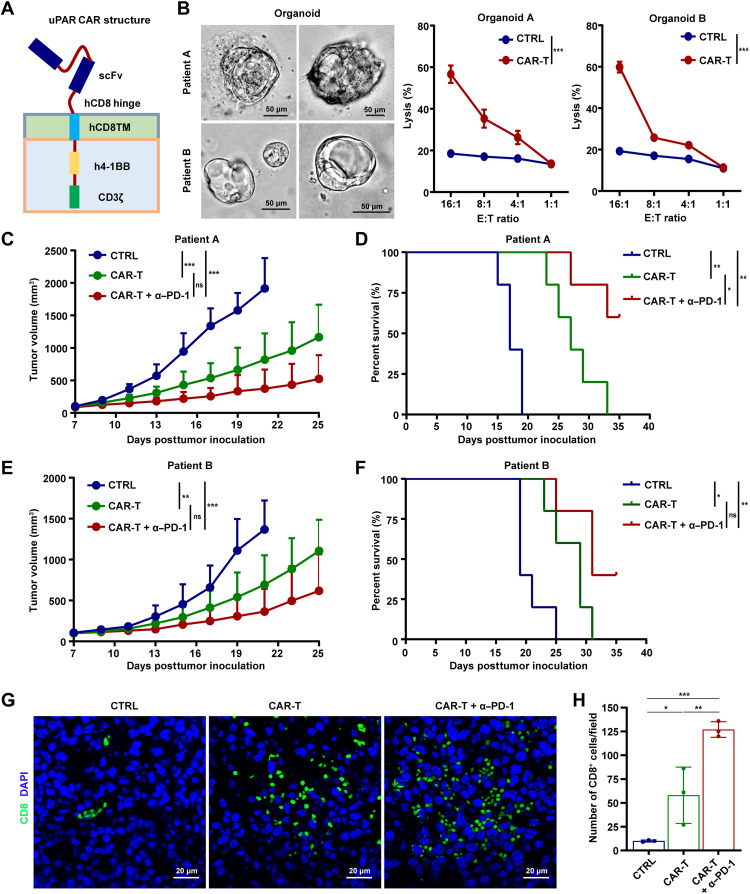
Fig. 6. uPAR CAR-T cells alone or in combination with PD-1 blockade suppress GC growth and prolong survival.
(A) Schematic diagram of uPAR CAR. (B) Representative images of DGC patient–derived organoids and killing efficiency of organoids by uPAR CAR-T cells determined by a lactate dehydrogenase (LDH)–based cytotoxicity assay, using untransduced T cells as a negative control. E:T, effector cells:target cells. (C to F) Tumor growth (C and E) and survival curves (D and F) of mice bearing the PDX derived from patient A or B (n = 5 per group; uPAR CAR-T or CTRL cells 2 × 10⁶, I.V., only once at 7 dpi; anti–PD-1 mAb 10 mg/kg, I.P., every 5 days starting from 8 dpi). (G and H) IF staining (G) and quantification (H) of cytotoxic CD8+ T cells in the PDX derived from patient A at 21 dpi. Data are represented as means ± SEM (*P < 0.05, **P < 0.01, and ***P < 0.001).

