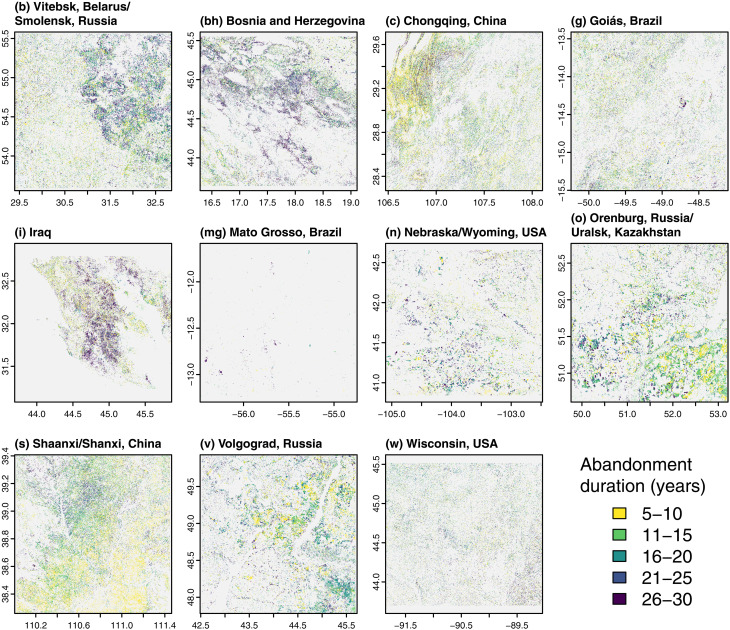
Fig. 2. Spatial patterns of abandonment duration.
Observed duration of cropland abandonment (in years) as of 2017 in our 11 study sites. X axes show degrees longitude relative to the prime meridian (negative indicating west and positive indicating east), and y axes show degrees latitude relative to equator (negative indicating south and positive indicating north). Site locations are shown in Fig. 1, and maps of maximum abandonment duration are shown in fig. S1.

