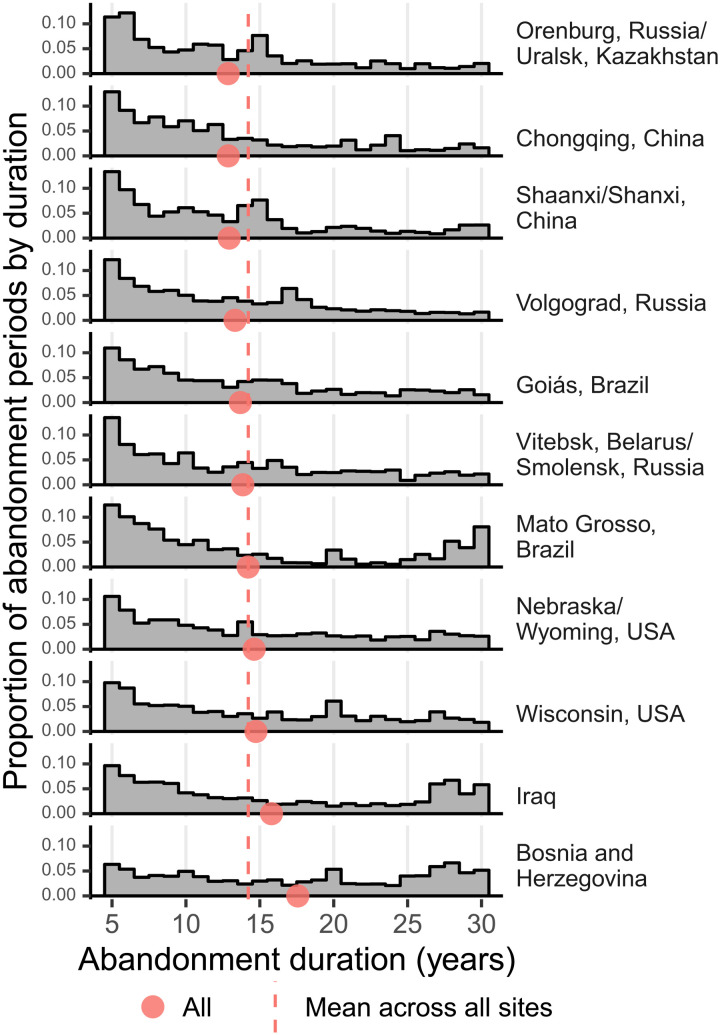
Fig. 4. Distribution of abandonment duration during time series.
The distribution of observed abandonment duration (in years) for all periods of abandonment from 1987 to 2017. The y axes show the proportion of abandonment periods of a given duration at each site. The red points represent the mean abandonment duration (in years) at each site, and the red vertical dashed line represents the mean of these site-level mean duration values across all sites. Note that these distributions include multiple periods of abandonment for those pixels that experienced abandonment and recultivation multiple times during the time series. See the Supplementary Materials for distributions of the maximum abandonment duration for each pixel (fig. S2), the potential abandonment duration without recultivation (fig. S6), and the duration of recultivation (fig. S7).

