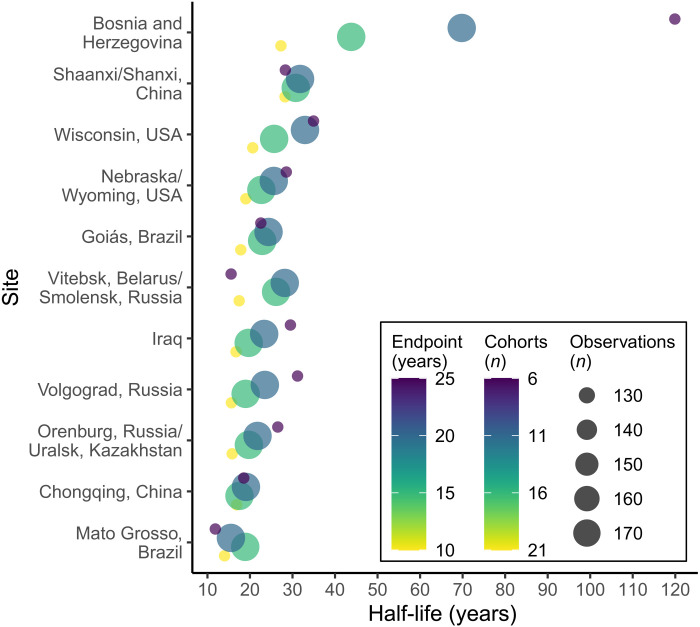
Fig. 7. Half-life of abandonment.
Mean half-lives of abandoned croplands at each site, calculated across a range of common endpoints. To make fair comparisons across cohorts with varying numbers of observations, we subset our data to a range of common endpoints (e.g., 15 years), restricting cohorts to the same number of observations. For each endpoint, we then calculated the mean trajectory across cohorts that meet the endpoint threshold and used these mean trajectories to calculate the half-life (i.e., the time required for half of a cohort to be recultivated; see Materials and Methods). See fig. S17 to see half-lives for the full range of endpoints.

