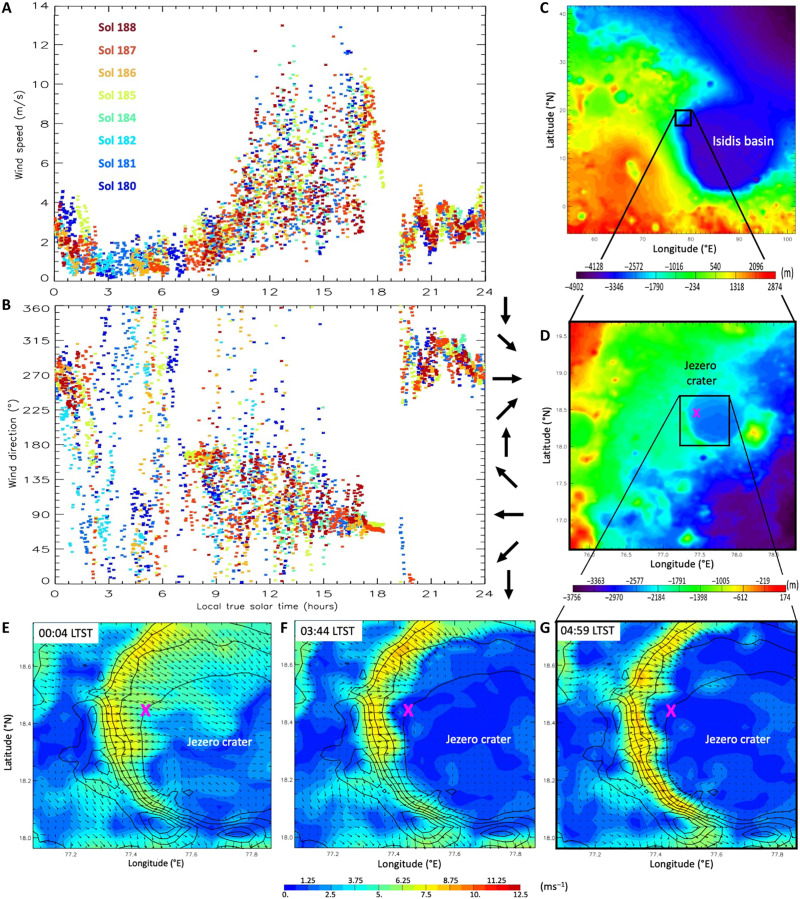
Fig. 1. Observed winds, regional and local topography, and modeled local slope control at night.
Minute-averaged horizontal (A) wind speed and (B) direction the wind blows from at 1.45 m, observed by MEDA over 8 sols at Ls ~ 90°. (C and D) Location of landing site relative to Jezero crater and Isidis basin, showing (C) regional and (D) local scale topography. (E to G) Intensification and concentration of crater rim downslope flows from midnight to 5 a.m. local true solar time (LTST), shown as wind speed (shading) and vectors (arrows), simulated by the MarsWRF mesoscale model. Topography is shown as black contours, and the landing site is marked with a pink X.

