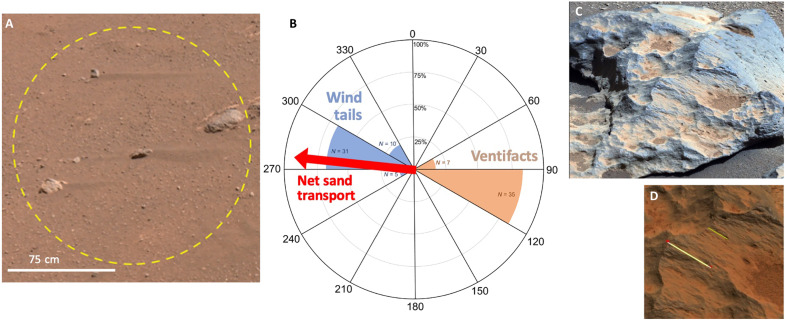
Fig. 2. Aeolian features and net sand transport direction over the first 216 sols.
(A) “Wind tails” of sandy regolith extending from small rocks indicate wind-driven sand transport directions, as seen in this portion of a Navcam image taken on sol 32. (B) Rose diagram showing the orientation of wind tails (blue) and ventifacts (orange) observed along the rover traverse, as well as net sand transport estimated from MEDA winds and air densities (red arrow) over the first 216 sols. (C) A ventifact imaged by Mastcam-Z. (D) An example of azimuth measurements of flutes, from which the transport direction of abrading grains is inferred.

