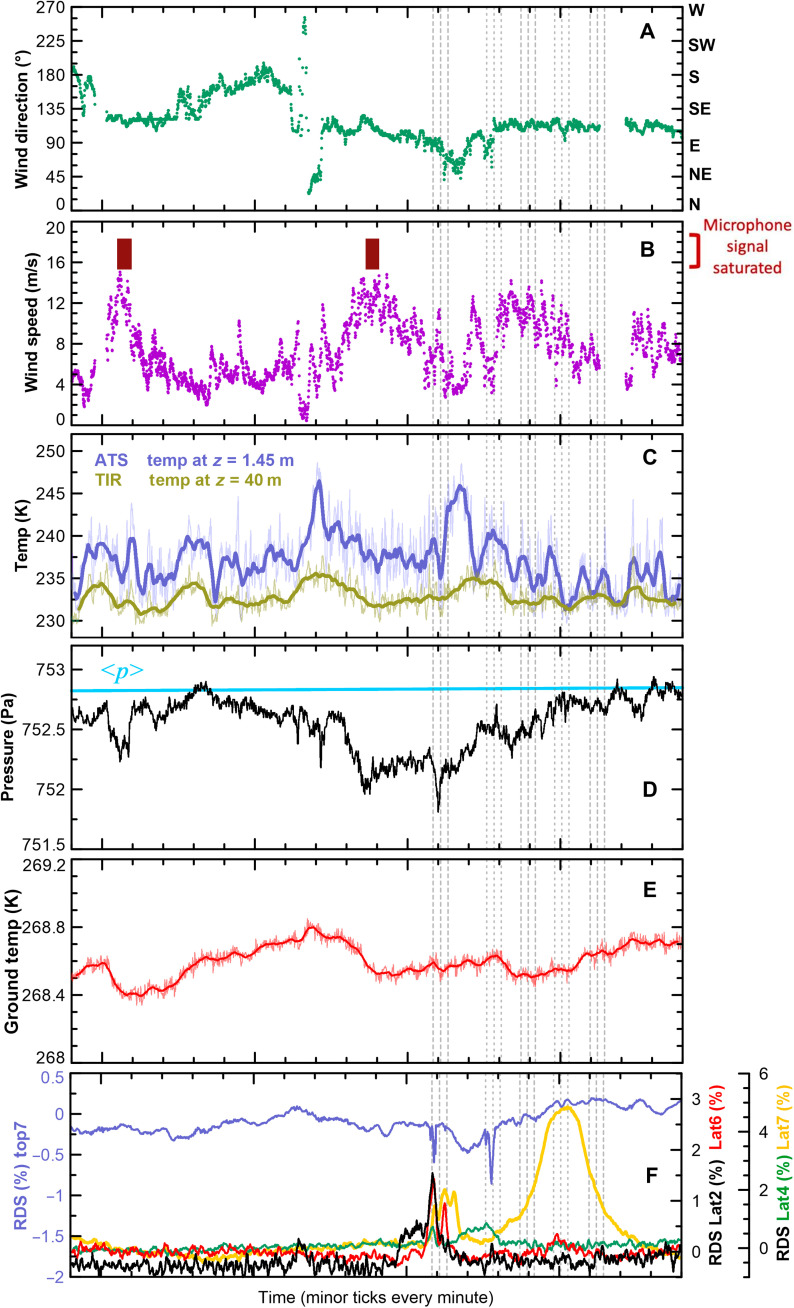
Fig. 4. The sol 117 gust lifting event in meteorological time series.
(A to E) Time series of meteorological data over 20 min surrounding the sol 117 Navcam survey, with the timing of the five image triplets shown by vertical dotted lines. (A) MEDA direction that wind blows from. (B) MEDA wind speeds (purple) and periods with saturated SuperCam microphone signals (red boxes). (C) MEDA 1-Hz (thin lines) and 15-s running-average smoothed (thick lines) air temperature at 1.45 m (blue) and ~40 m (chartreuse). (D) MEDA surface pressure (black line) and an indication of the longer-term trend in pressure over the surrounding period (cyan). (E) As in (C) but showing MEDA surface temperature. (F) Percentage change in SW radiation measured by MEDA’s RDS top7 (blue), lat2 (black), lat4 (green), lat6 (red), and lat7 (yellow) photodiodes.

