
Figure 2.
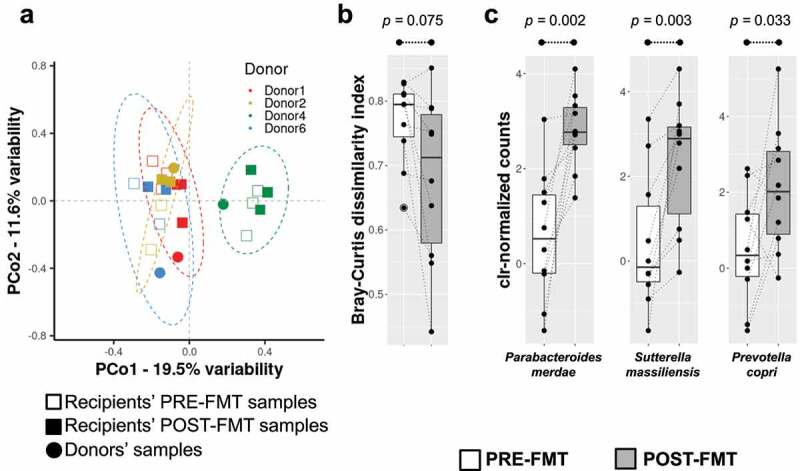
Beta diversity of the microbial communities assessed by rrn sequencing. a – Scatter plot compiling data from the multivariate analysis (principal coordinate analysis – PCoA) of the microbiota from recipients and donors participating in FMT. The donor and recipient samples and the sampling time points are defined according to the legend at the top. PCo; principal coordinate (the two most informative coordinates are shown). Color legend corresponds with the distribution of the different PRE-FMT and POST-FMT samples into the groups linked to the four donor samples evaluated (see legend into the plot). b – A Genetic distance-based approach for evaluating microbiota transfer between donor and recipient pairs. The microbial community structures of the PRE-FMT and POST-FMT samples were compared with those of the donors through the calculation of the Bray-Curtis dissimilarity index and are represented as boxplots. The Wilcoxon signed-rank test for paired samples was used to compare differences in genetic distances. c – Microbiota abundance shifts after FMT. Abundance data distribution for three species selected from those described in Table 1 with meaningful increase after FMT is shown in boxplot fashion.